Fig. 2
Download original image
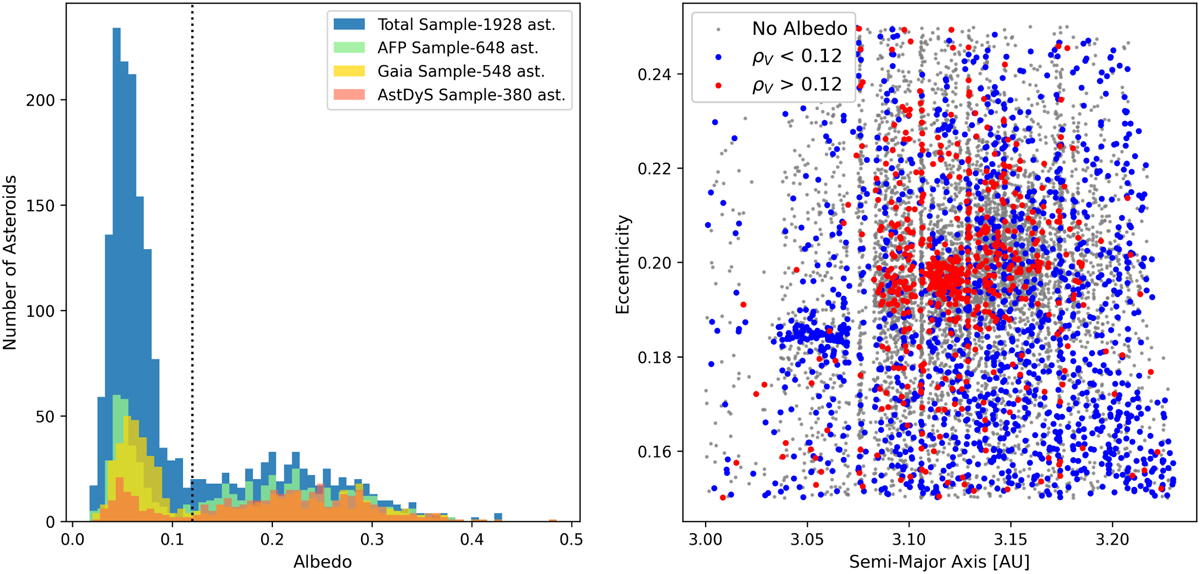
Albedo distribution of the objects located within the Tirela/Klumpkea region. Left panel: NEOWISE albedo distribution for the objects of the complete sample (in blue), of the Gaia sample (in yellow), of the family members listed in AstDyS (in red) and of the family members listed in AFP (in green). The vertical black dotted line at ρV = 0.12 separates low albedo from high albedo objects. Right panel: distribution in the (a, e) plane of the objects located within the Tirela/Klumpkea region. Blue points have ρV < 0.12, red points have ρV > 0.12, and grey points do not have albedo measurements.
Current usage metrics show cumulative count of Article Views (full-text article views including HTML views, PDF and ePub downloads, according to the available data) and Abstracts Views on Vision4Press platform.
Data correspond to usage on the plateform after 2015. The current usage metrics is available 48-96 hours after online publication and is updated daily on week days.
Initial download of the metrics may take a while.