Open Access
Fig. 16
Download original image
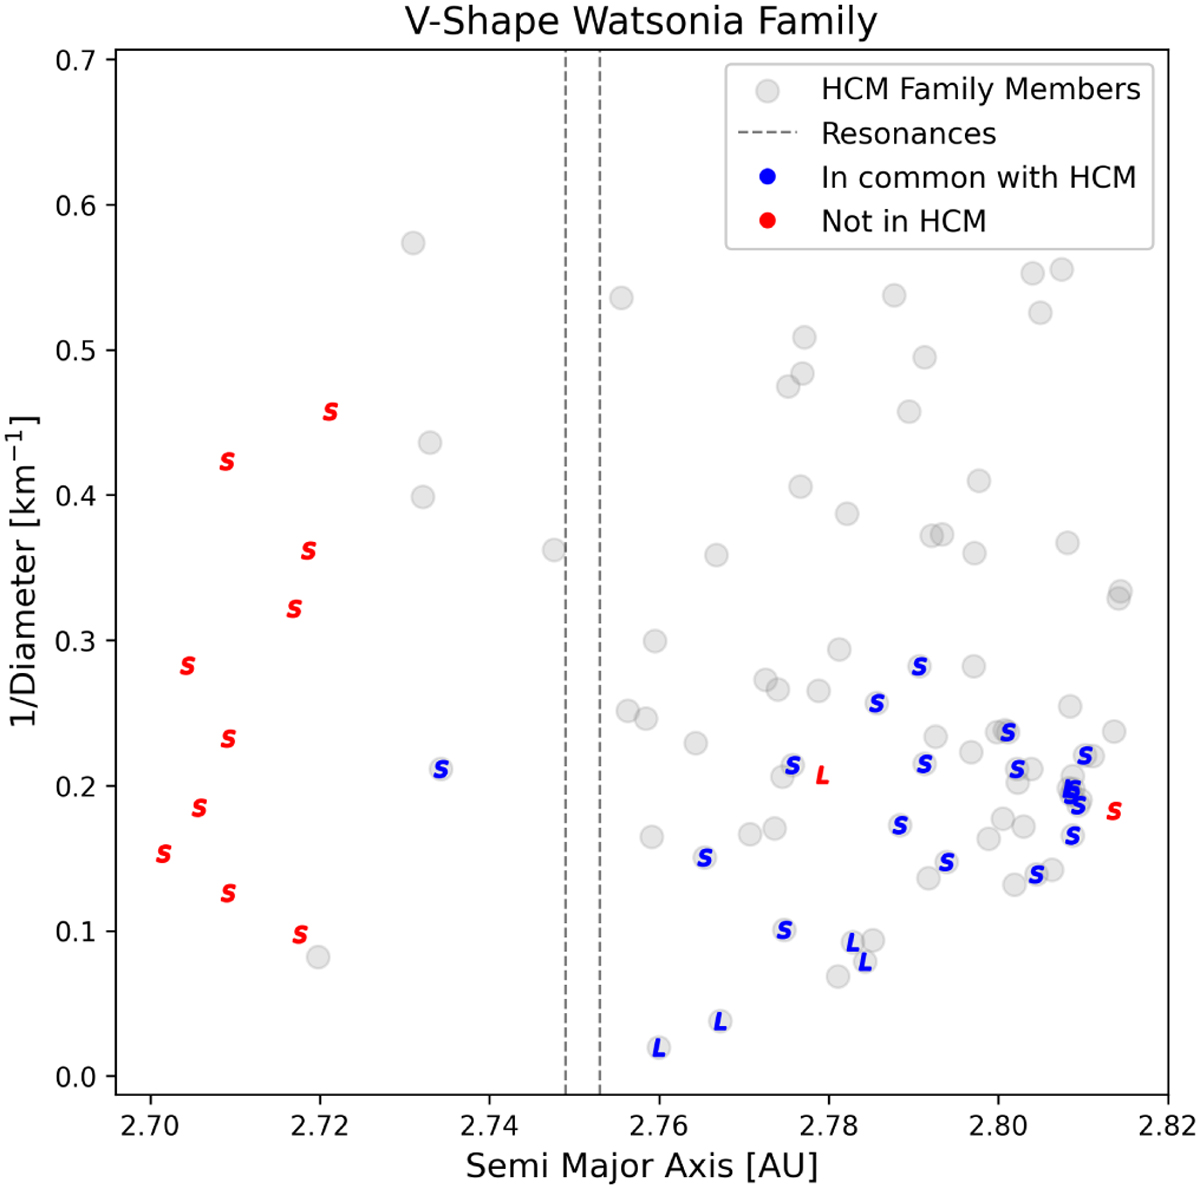
Distribution in the (a, 1/D) plane of the Watsonia family members, marked by the corresponding taxonomy class letters. In blue, we show objects in common between our work and the HCM. In red, we show objects that are not identified by the HCM. The grey circles indicate all the family members identified by the HCM.
Current usage metrics show cumulative count of Article Views (full-text article views including HTML views, PDF and ePub downloads, according to the available data) and Abstracts Views on Vision4Press platform.
Data correspond to usage on the plateform after 2015. The current usage metrics is available 48-96 hours after online publication and is updated daily on week days.
Initial download of the metrics may take a while.