| Issue |
A&A
Volume 688, August 2024
|
|
|---|---|---|
| Article Number | C2 | |
| Number of page(s) | 1 | |
| Section | Galactic structure, stellar clusters and populations | |
| DOI | https://doi.org/10.1051/0004-6361/202450839e | |
| Published online | 12 August 2024 | |
Hunting young stars in the Galactic centre
Hundreds of thousands of solar masses of young stars in the Sagittarius C region (Corrigendum)
European Southern Observatory, Karl-Schwarzschild-Strasse 2, 85748 Garching bei München, Germany
e-mail: francisco.nogueraslara@eso.org
Key words: dust / extinction / HII regions / Galaxy: center / Galaxy: nucleus / Galaxy: structure / errata, addenda
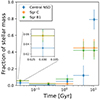
We have detected an error in Fig. 7 of Nogueras-Lara (2024). The fraction of stellar mass corresponding to the central nuclear stellar disc (NSD), obtained by Nogueras-Lara et al. (2022), was erroneously multiplied by ten in the age bin between 0.06 and 0.5 Gyr in the figure. Additionally, the colours in the zoom-in panel were switched between the Sgr C and Sgr B1 regions. Figure 1 shows the corrected version.
 |
Fig. 1. Comparison between the stellar population present in the central region of the NSD, Sgr B1 (data extracted from Fig. 4 in Nogueras-Lara et al. 2022), and Sgr C (this work). The zoomed-in image shows the youngest age bin, where Sgr B1 and Sgr C show an excess of young stars in comparison to the central region of the NSD. |
References
- Nogueras-Lara, F. 2024, A&A, 681, L21 [NASA ADS] [CrossRef] [EDP Sciences] [Google Scholar]
- Nogueras-Lara, F., Schödel, R., & Neumayer, N. 2022, Nature Astronomy, 6, 1178 [NASA ADS] [CrossRef] [Google Scholar]
© The Authors 2024
 Open Access article, published by EDP Sciences, under the terms of the Creative Commons Attribution License (https://creativecommons.org/licenses/by/4.0), which permits unrestricted use, distribution, and reproduction in any medium, provided the original work is properly cited.
This article is published in open access under the Subscribe to Open model. Subscribe to A&A to support open access publication.
All Figures
 |
Fig. 1. Comparison between the stellar population present in the central region of the NSD, Sgr B1 (data extracted from Fig. 4 in Nogueras-Lara et al. 2022), and Sgr C (this work). The zoomed-in image shows the youngest age bin, where Sgr B1 and Sgr C show an excess of young stars in comparison to the central region of the NSD. |
| In the text | |
Current usage metrics show cumulative count of Article Views (full-text article views including HTML views, PDF and ePub downloads, according to the available data) and Abstracts Views on Vision4Press platform.
Data correspond to usage on the plateform after 2015. The current usage metrics is available 48-96 hours after online publication and is updated daily on week days.
Initial download of the metrics may take a while.


