Fig. 6.
Download original image
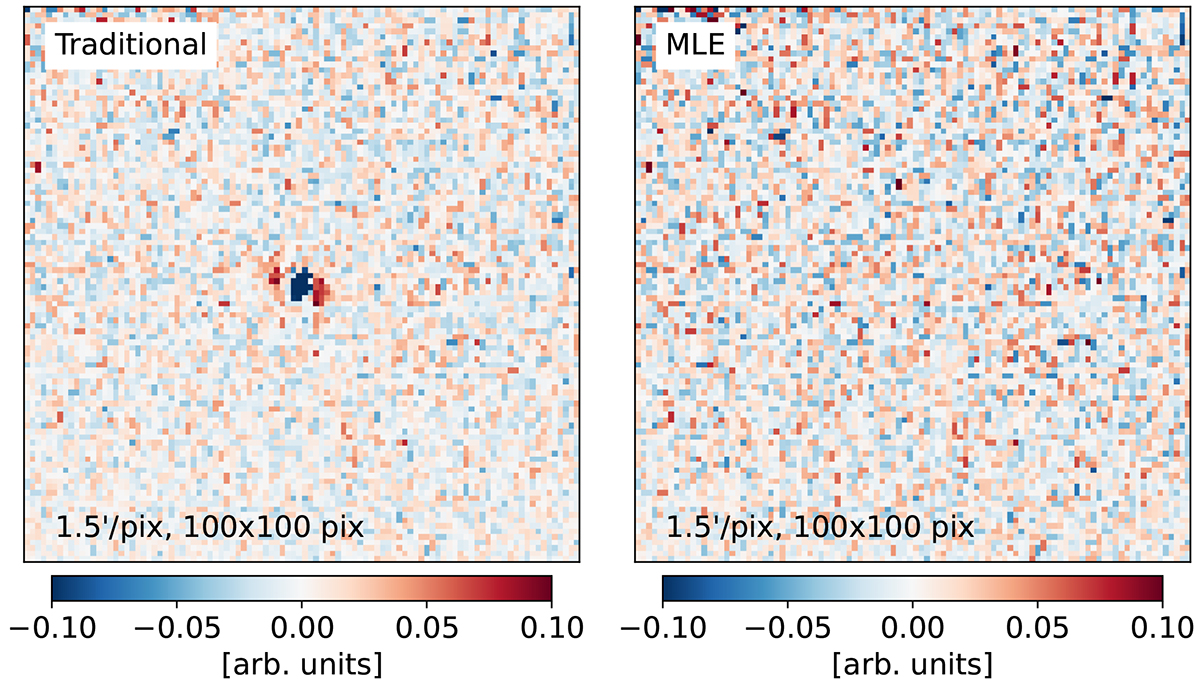
Residual comparison between the traditional deconvolution method and MLE based deconvolution method. The left panel shows the residual between the signal deconvolved using the inverse of the transfer function operator T−1 in combination with filter K(ω) and the original point source signal s (left panel in Fig. 5). The right panel shows the residual between the signal deconvolved by solving Eq. (5) and the original point source signal.
Current usage metrics show cumulative count of Article Views (full-text article views including HTML views, PDF and ePub downloads, according to the available data) and Abstracts Views on Vision4Press platform.
Data correspond to usage on the plateform after 2015. The current usage metrics is available 48-96 hours after online publication and is updated daily on week days.
Initial download of the metrics may take a while.