Open Access
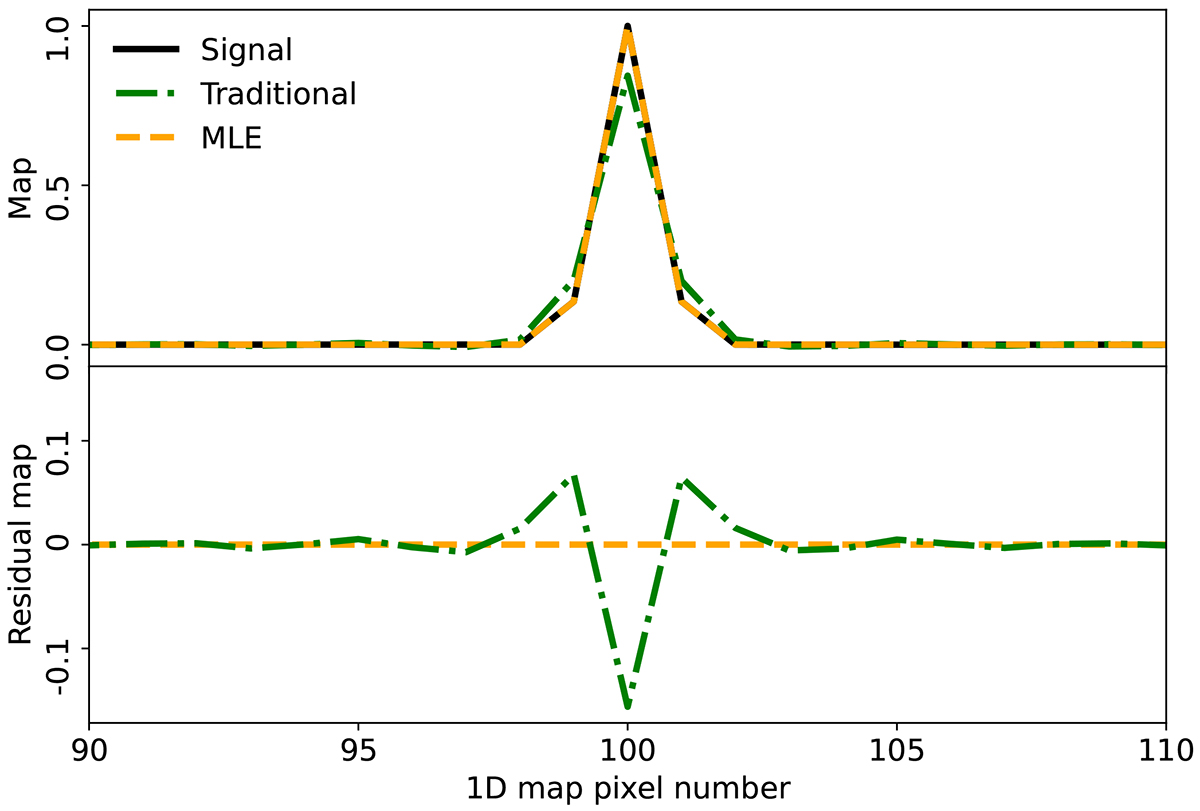
Fig. 4.
Download original image
Comparison of reconstructed 1D point source signals for ![]() (dashed green) and
(dashed green) and ![]() . The top panel shows the full reconstructed signal amplitude, with the true input shown as a solid black line, and the bottom panel shows the difference between output and input signals.
. The top panel shows the full reconstructed signal amplitude, with the true input shown as a solid black line, and the bottom panel shows the difference between output and input signals.
Current usage metrics show cumulative count of Article Views (full-text article views including HTML views, PDF and ePub downloads, according to the available data) and Abstracts Views on Vision4Press platform.
Data correspond to usage on the plateform after 2015. The current usage metrics is available 48-96 hours after online publication and is updated daily on week days.
Initial download of the metrics may take a while.