Fig. 10.
Download original image
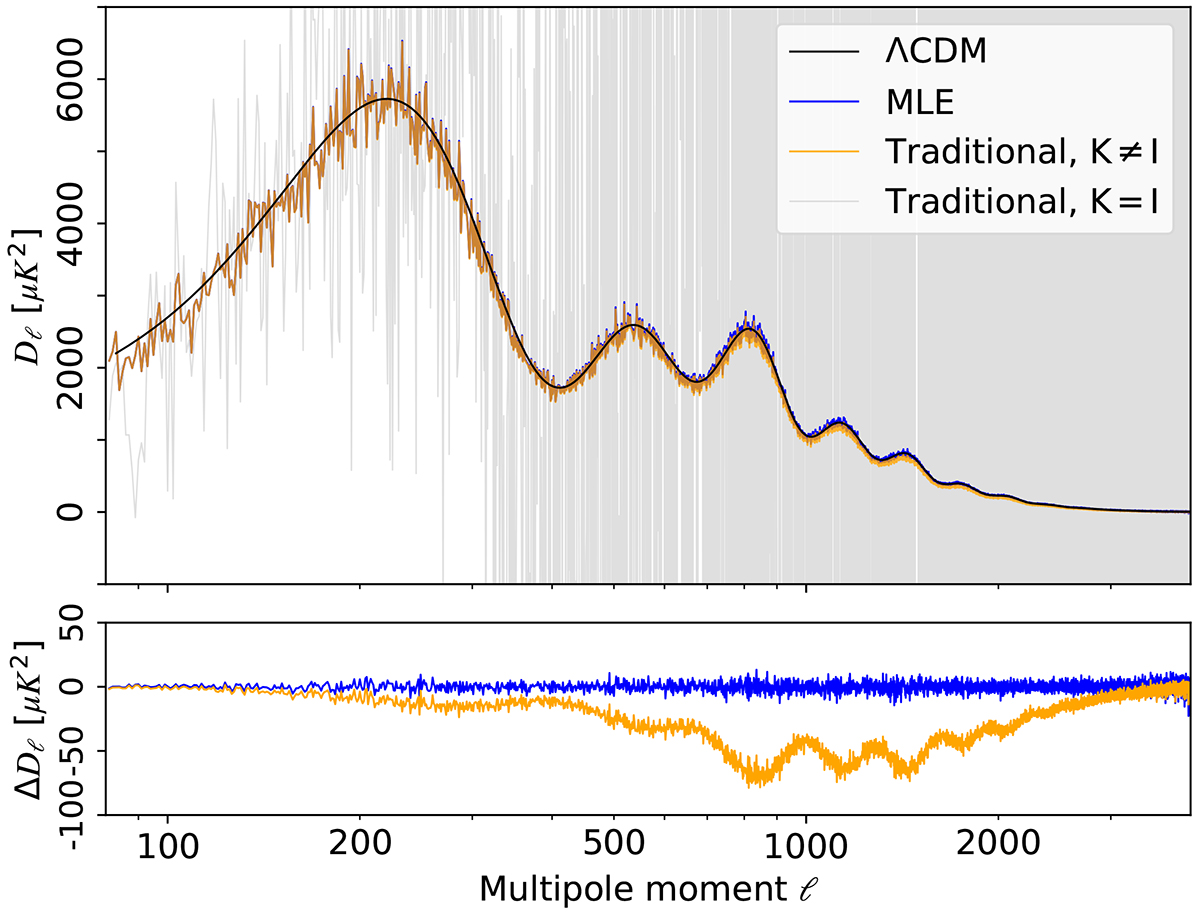
Upper panel: power spectra Dℓ of the deconvolved CMB maps. The original signal was simulated based on the ΛCDM spectrum shown with the black solid line. The blue line shows the power spectrum obtained from the maximum likelihood based deconvolution. The orange line shows the power spectrum of the map obtained from the traditional deconvolution process KT−1d. The grey line shows the power spectrum of the map obtained from the unfiltered (K = I) traditional deconvolution process T−1d. All spectra are calculated as cross power spectra using two noise realisations ![]() , to exclude the white noise power spectrum. Lower panel: difference between the deconvolved power spectra and input ΛCDM power spectrum. The colors represent the difference for the respective deconvolution method in the upper panel.
, to exclude the white noise power spectrum. Lower panel: difference between the deconvolved power spectra and input ΛCDM power spectrum. The colors represent the difference for the respective deconvolution method in the upper panel.
Current usage metrics show cumulative count of Article Views (full-text article views including HTML views, PDF and ePub downloads, according to the available data) and Abstracts Views on Vision4Press platform.
Data correspond to usage on the plateform after 2015. The current usage metrics is available 48-96 hours after online publication and is updated daily on week days.
Initial download of the metrics may take a while.