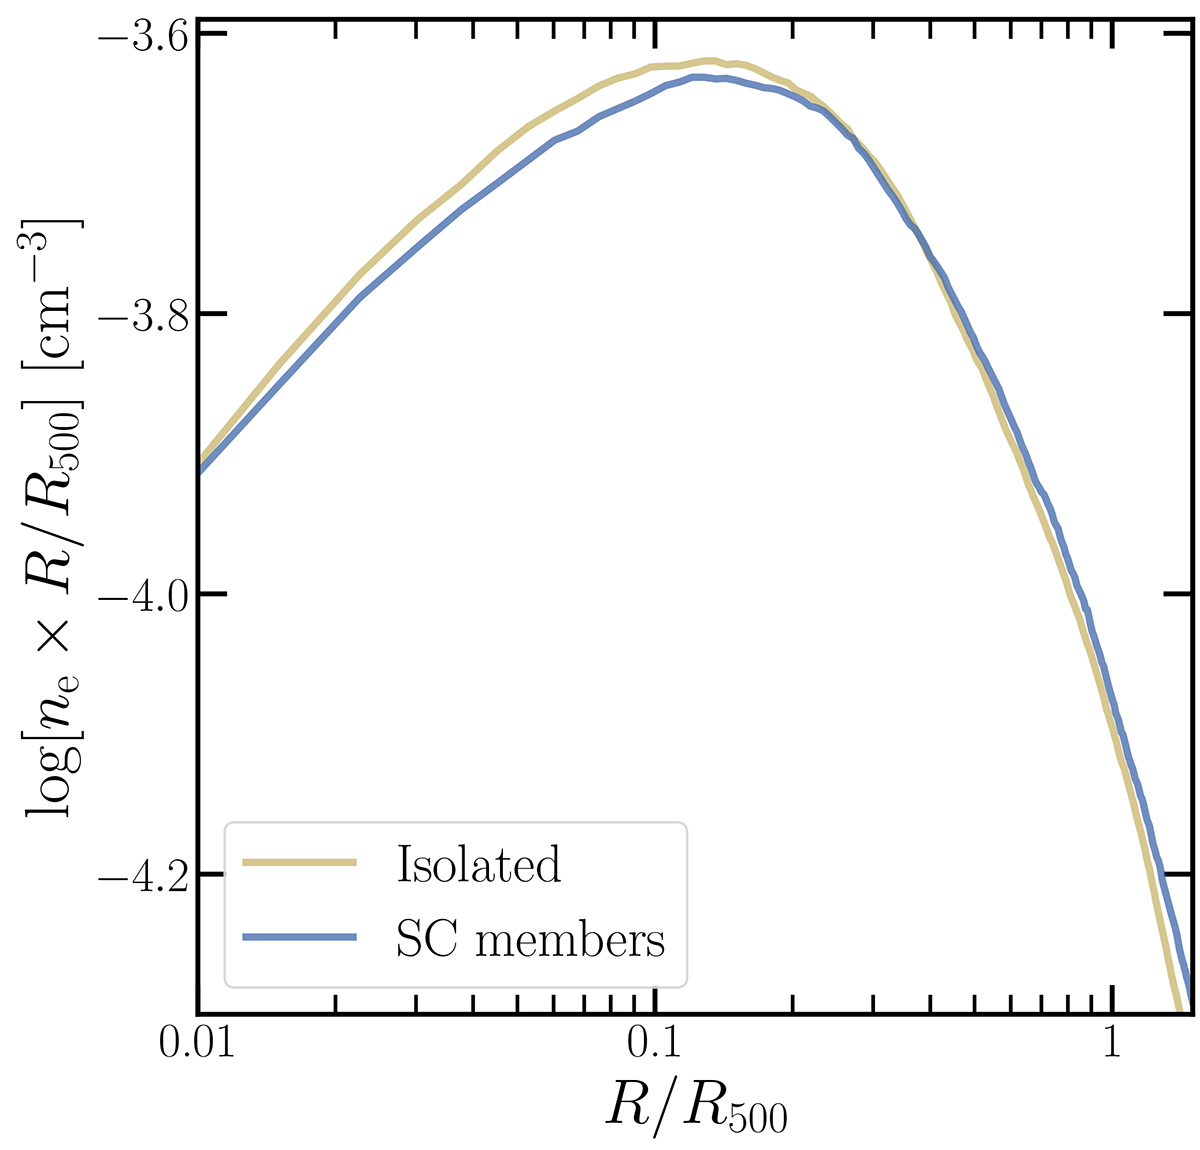
Fig. 8.
Download original image
Same as the left panel of Fig. 3 but without considering the difference in exposure time of the supercluster members and isolated clusters. The y-axis is rescaled by the radius to reduce the dynamic range of the plot and improve the visibility of the difference between the two samples. The median electron density profile of supercluster members (blue) shows an apparently lower concentration than that of the isolated clusters (yellow). However, this trend should not be simply interpreted as the signal of HAB. It is mostly caused by the fact that supercluster members are located in areas with higher survey depths, where low-concentration clusters have a higher probability of being detected. This plot demonstrates the importance of correcting for selection effects in the analysis of HAB.
Current usage metrics show cumulative count of Article Views (full-text article views including HTML views, PDF and ePub downloads, according to the available data) and Abstracts Views on Vision4Press platform.
Data correspond to usage on the plateform after 2015. The current usage metrics is available 48-96 hours after online publication and is updated daily on week days.
Initial download of the metrics may take a while.