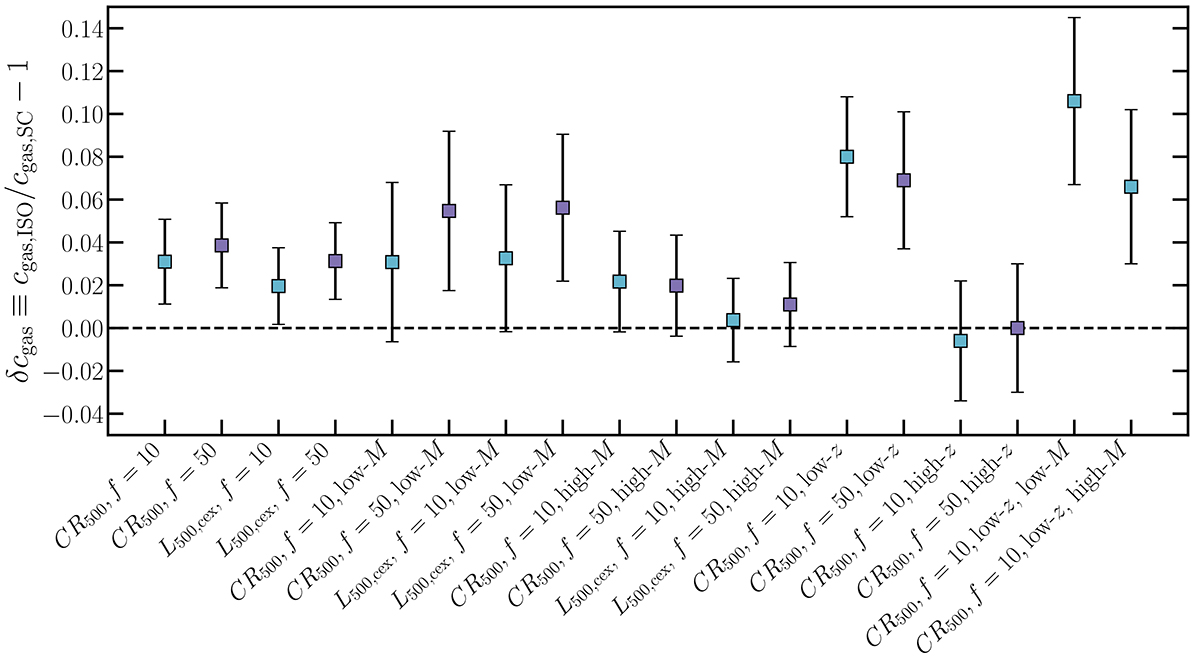
Fig. 6.
Download original image
Summary of the results for δcgas obtained in this work for different choices of overdensity ratio f in supercluster identification, cluster mass proxy, and mass range. The results for f = 10 and f = 50 are plotted in cyan and purple, respectively, to show the increasing trend in δcgas with f. The two measurements for the total mass concentration obtained from weak-lensing analysis, ![]() for f = 10 and
for f = 10 and ![]() , are not shown in this plot because they are much larger than the gas mass concentration results.
, are not shown in this plot because they are much larger than the gas mass concentration results.
Current usage metrics show cumulative count of Article Views (full-text article views including HTML views, PDF and ePub downloads, according to the available data) and Abstracts Views on Vision4Press platform.
Data correspond to usage on the plateform after 2015. The current usage metrics is available 48-96 hours after online publication and is updated daily on week days.
Initial download of the metrics may take a while.