Fig. 4.
Download original image
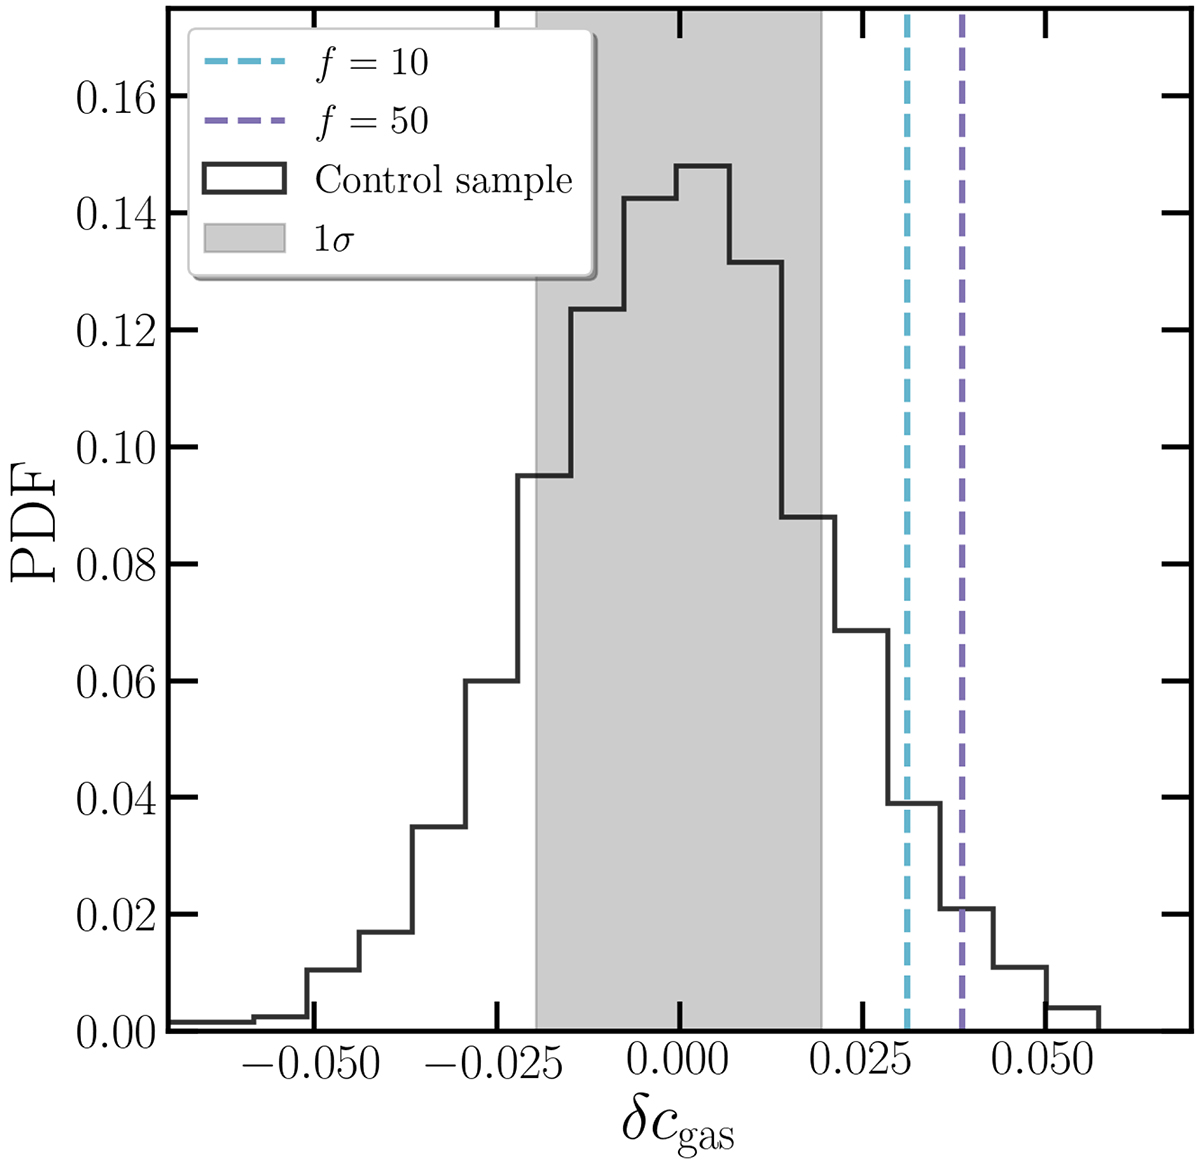
Confidence level of the excess in gas mass concentration, cgas. The histogram shows the distribution of δcgas defined as cgas, S1/cgas, S2 − 1 when randomly dividing the clusters into two subsamples (S1 and S2) and repeating 1000 times. The dashed lines indicate the δcgas when the clusters are divided into supercluster members and isolated clusters. The results are shown for different overdensity ratios in the identification of superclusters. The shaded area represents 1σ uncertainty. The cyan and purple lines correspond to 1.6σ for f = 10 and 2.0σ for f = 50, respectively.
Current usage metrics show cumulative count of Article Views (full-text article views including HTML views, PDF and ePub downloads, according to the available data) and Abstracts Views on Vision4Press platform.
Data correspond to usage on the plateform after 2015. The current usage metrics is available 48-96 hours after online publication and is updated daily on week days.
Initial download of the metrics may take a while.