Fig. 3.
Download original image
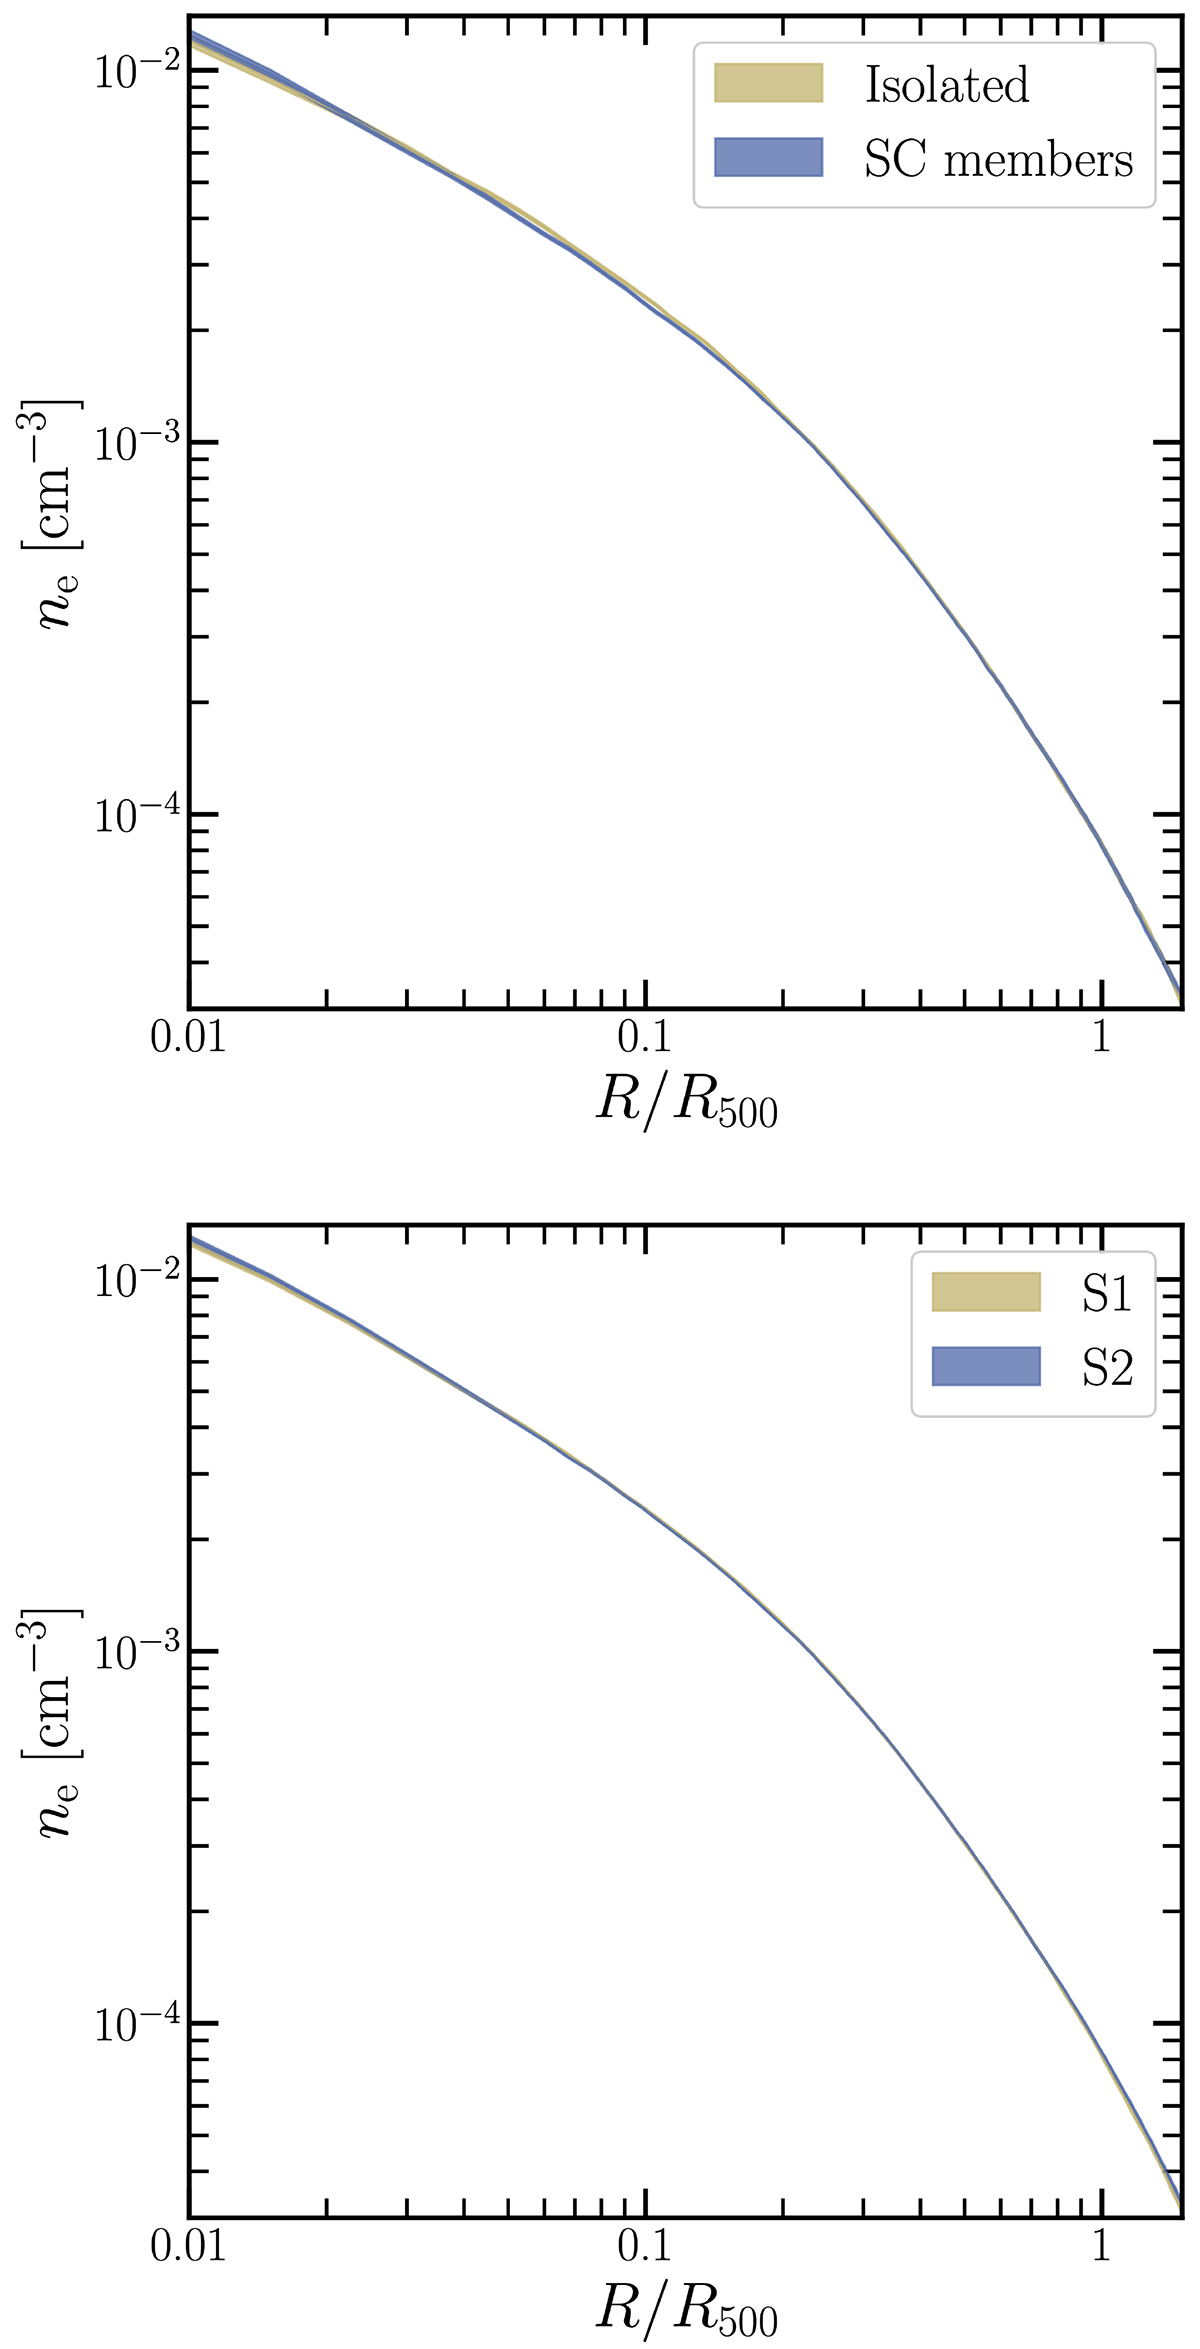
Median electron density profiles. In the upper panel, the results for supercluster members and isolated clusters are plotted in blue and yellow, respectively. The uncertainties of the two profiles are almost negligible due to the large number of clusters in each sample. The difference in gas mass concentration between the two samples is almost invisible. In the lower panel, we plot the results for the two control samples, which are selected by randomly dividing the cluster sample into two.
Current usage metrics show cumulative count of Article Views (full-text article views including HTML views, PDF and ePub downloads, according to the available data) and Abstracts Views on Vision4Press platform.
Data correspond to usage on the plateform after 2015. The current usage metrics is available 48-96 hours after online publication and is updated daily on week days.
Initial download of the metrics may take a while.