Fig. 1.
Download original image
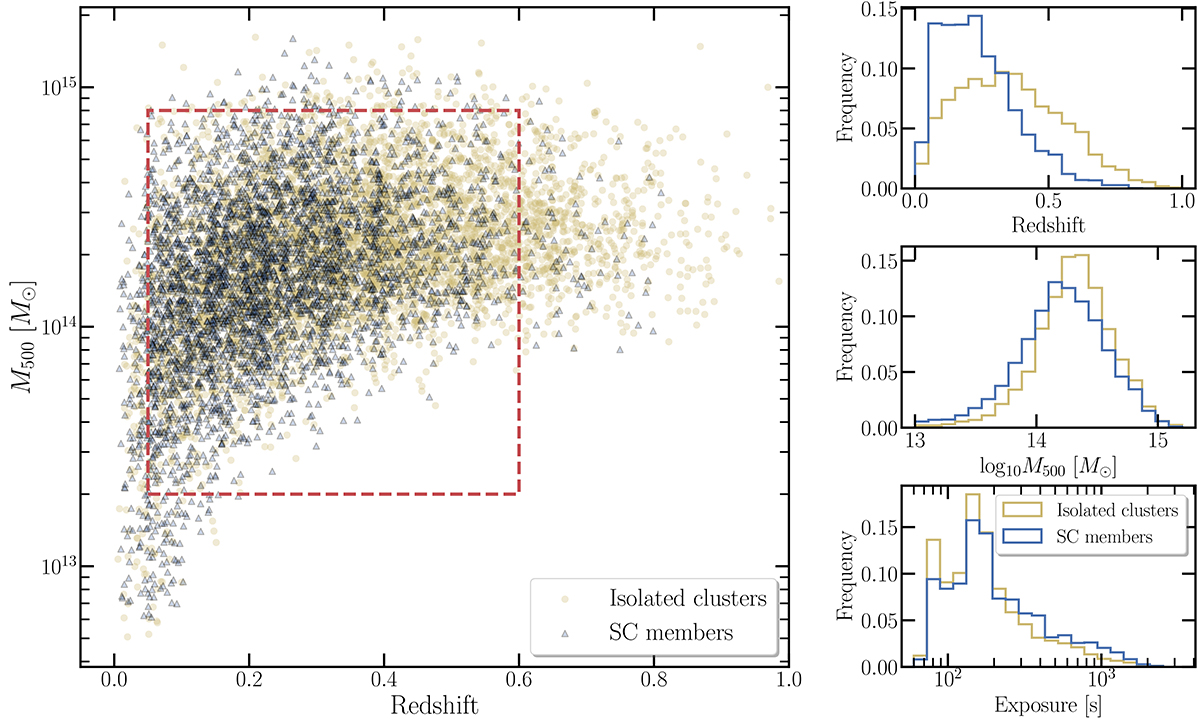
Comparison of the properties of the two subsamples before trimming: blue for supercluster members and yellow for isolated clusters. The red rectangle in the left panel defines the M − z space where we select the subsamples for further selection (trimming). The histograms in the right panel show the distribution of redshift, mass, and exposure time of the two subsamples before the trimming process.
Current usage metrics show cumulative count of Article Views (full-text article views including HTML views, PDF and ePub downloads, according to the available data) and Abstracts Views on Vision4Press platform.
Data correspond to usage on the plateform after 2015. The current usage metrics is available 48-96 hours after online publication and is updated daily on week days.
Initial download of the metrics may take a while.