Fig. 14
Download original image
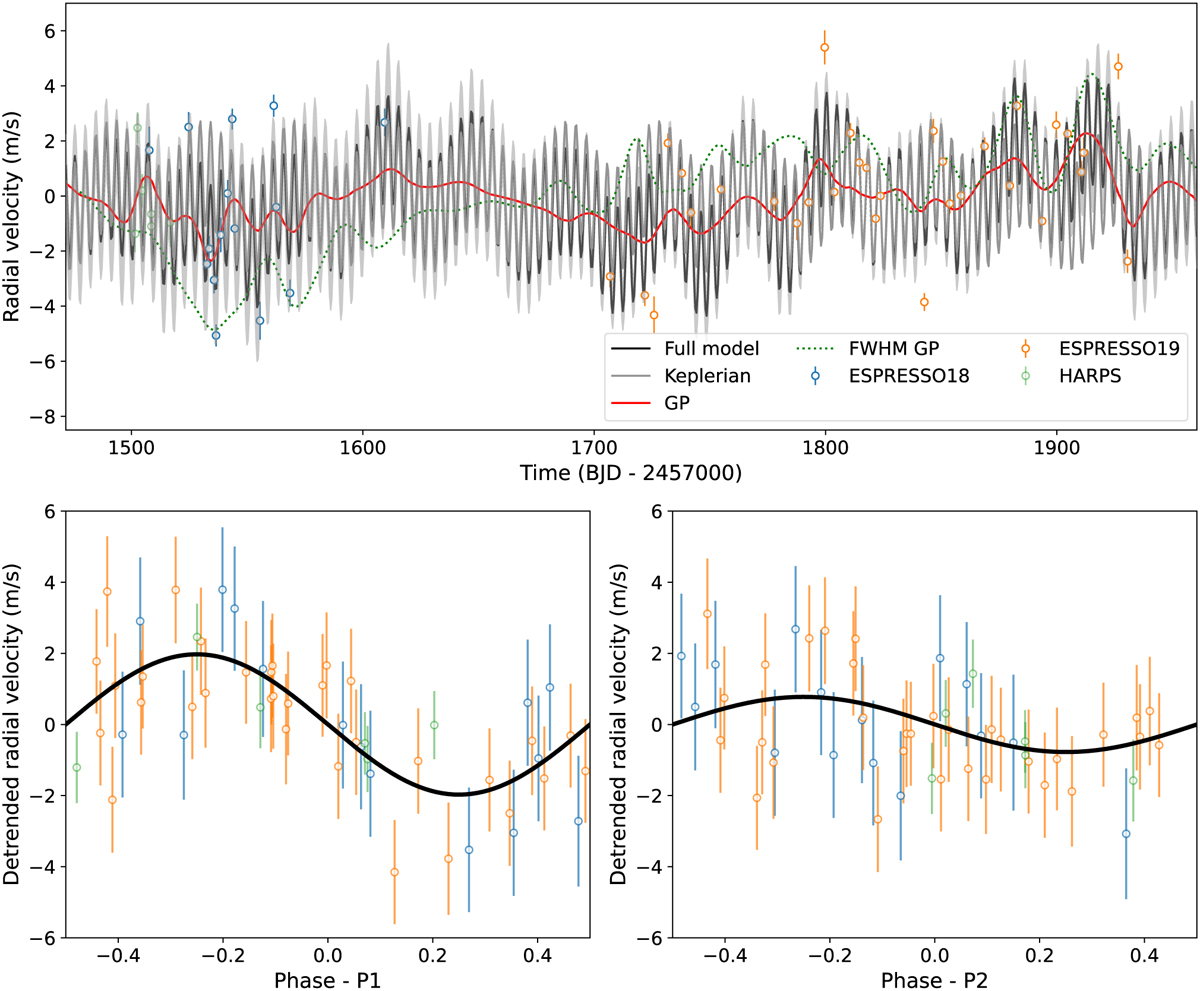
Top: radial velocities (ESPRESSO18, blue dots; ESPRESSO19, orange dots; and HARPS, green dots), model components (GP, red; and Keplerian, grey), and median circular model (black) for TOI-286. The error bars show the RV errors and jitter added in quadrature. The instrumental systemic velocity has been subtracted. The GP fit to the FWHM activity indicator is also shown (dotted green line) for comparison. Bottom: phase-folded radial velocities plus median Keplerian for the inner (left) and outer (right) candidates, following the same colour scheme.
Current usage metrics show cumulative count of Article Views (full-text article views including HTML views, PDF and ePub downloads, according to the available data) and Abstracts Views on Vision4Press platform.
Data correspond to usage on the plateform after 2015. The current usage metrics is available 48-96 hours after online publication and is updated daily on week days.
Initial download of the metrics may take a while.