Fig. 9
Download original image
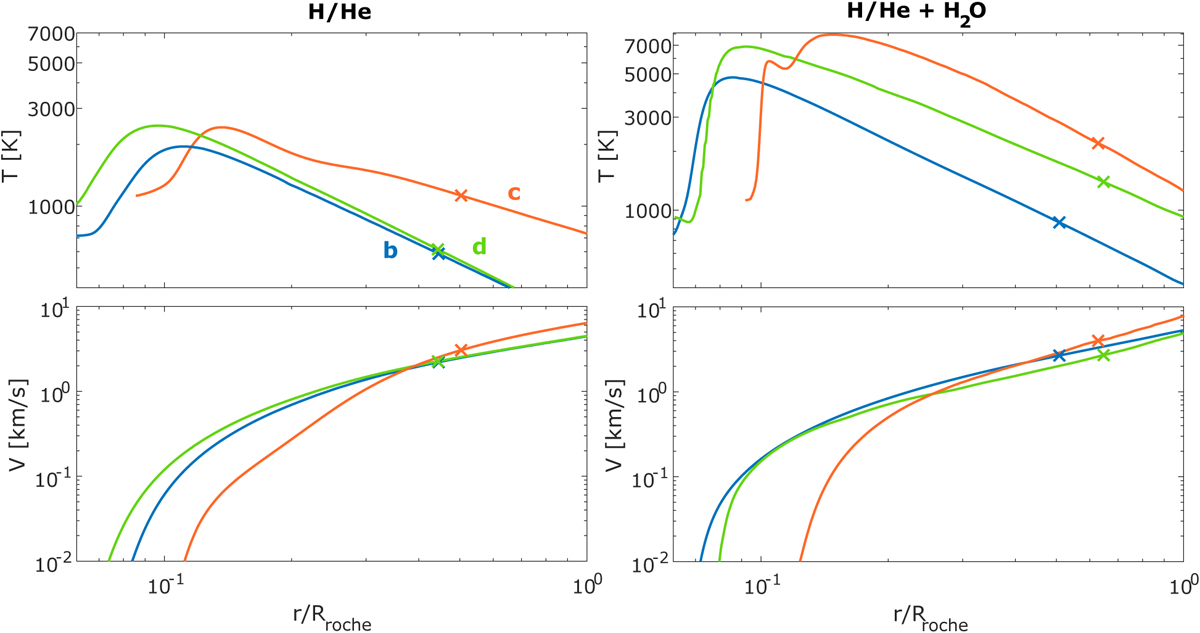
Atmospheric temperature (left Y-axis, solid lines) and bulk outflow velocity (right Y-axis, dashed lines) against radial distance normalised to the Roche radii of the planets, as predicted by CHAIN models. The top panel shows results for the H/He atmospheres and the bottom panel for H2O atmospheres. The different colours correspond to planets b (blue), c (orange), and d (green). The crosses denote the positions of sonic points.
Current usage metrics show cumulative count of Article Views (full-text article views including HTML views, PDF and ePub downloads, according to the available data) and Abstracts Views on Vision4Press platform.
Data correspond to usage on the plateform after 2015. The current usage metrics is available 48-96 hours after online publication and is updated daily on week days.
Initial download of the metrics may take a while.