Fig. 10
Download original image
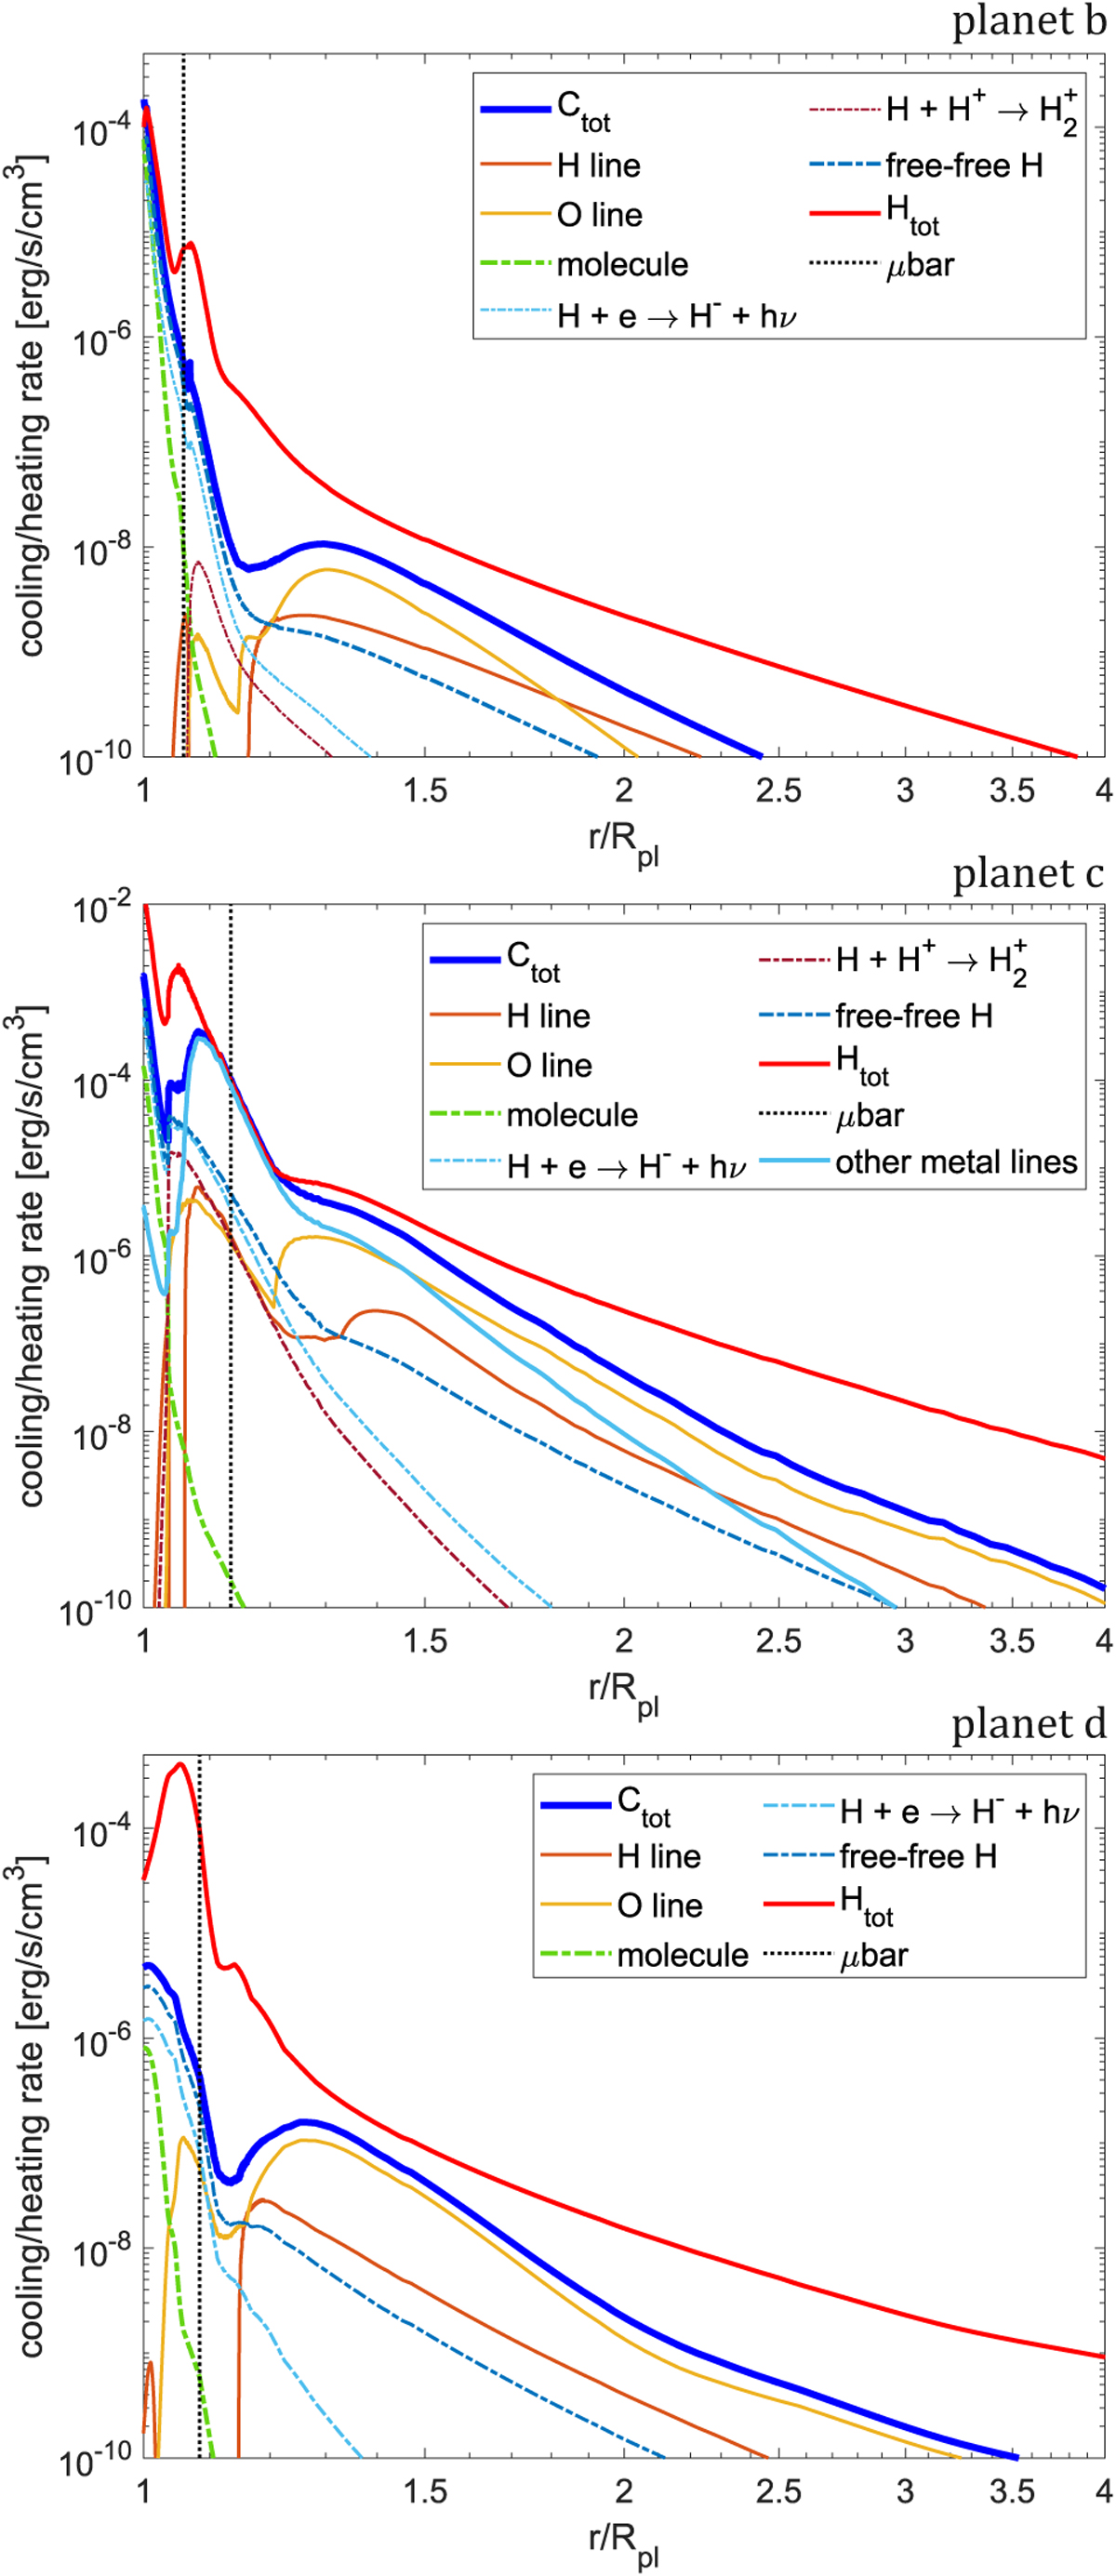
Radiative cooling and heating rates against radial distance for the CHAIN runs of the H2O atmospheres of planets b (top panel), c (middle panel), and d (bottom panel). The rates are shown between 1 and 4 Rpl, where most of the photochemistry takes place; higher altitudes are dominated by adiabatic expansion. For individual cooling processes, we only show those that contribute at least 5% to the total cooling rates (at some specific altitude). The line styles are explained in the legends, where the notation is the following: Ctot – total cooling rate (the sum of all radiative processes); Htot – total heating rate; μbar – the altitude corresponding to 1 μbar pressure level; X line – line cooling of the X element; molecule – the sum of molecule cooling processes (dominated by H2O molecule cooling); free-free H – bremsstrahlung cooling from hydrogen and helium.
Current usage metrics show cumulative count of Article Views (full-text article views including HTML views, PDF and ePub downloads, according to the available data) and Abstracts Views on Vision4Press platform.
Data correspond to usage on the plateform after 2015. The current usage metrics is available 48-96 hours after online publication and is updated daily on week days.
Initial download of the metrics may take a while.