Open Access
Fig. 4
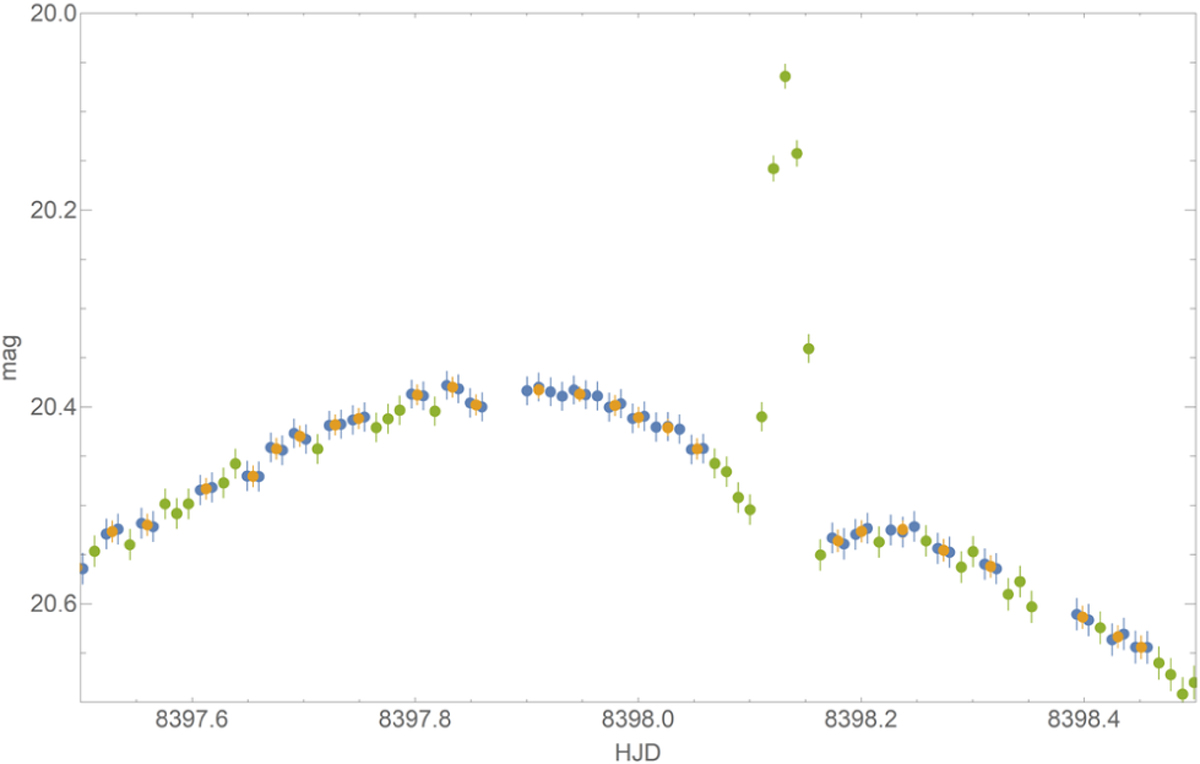
Download original image
Re-binning at work on a simulated event. Points from the original data untouched by re-binning are in green. Original points replaced by their re-binned versions with neighbors are in blue, new points resulting from re-binning are in yellow.
Current usage metrics show cumulative count of Article Views (full-text article views including HTML views, PDF and ePub downloads, according to the available data) and Abstracts Views on Vision4Press platform.
Data correspond to usage on the plateform after 2015. The current usage metrics is available 48-96 hours after online publication and is updated daily on week days.
Initial download of the metrics may take a while.