Open Access
Fig. 10
Download original image
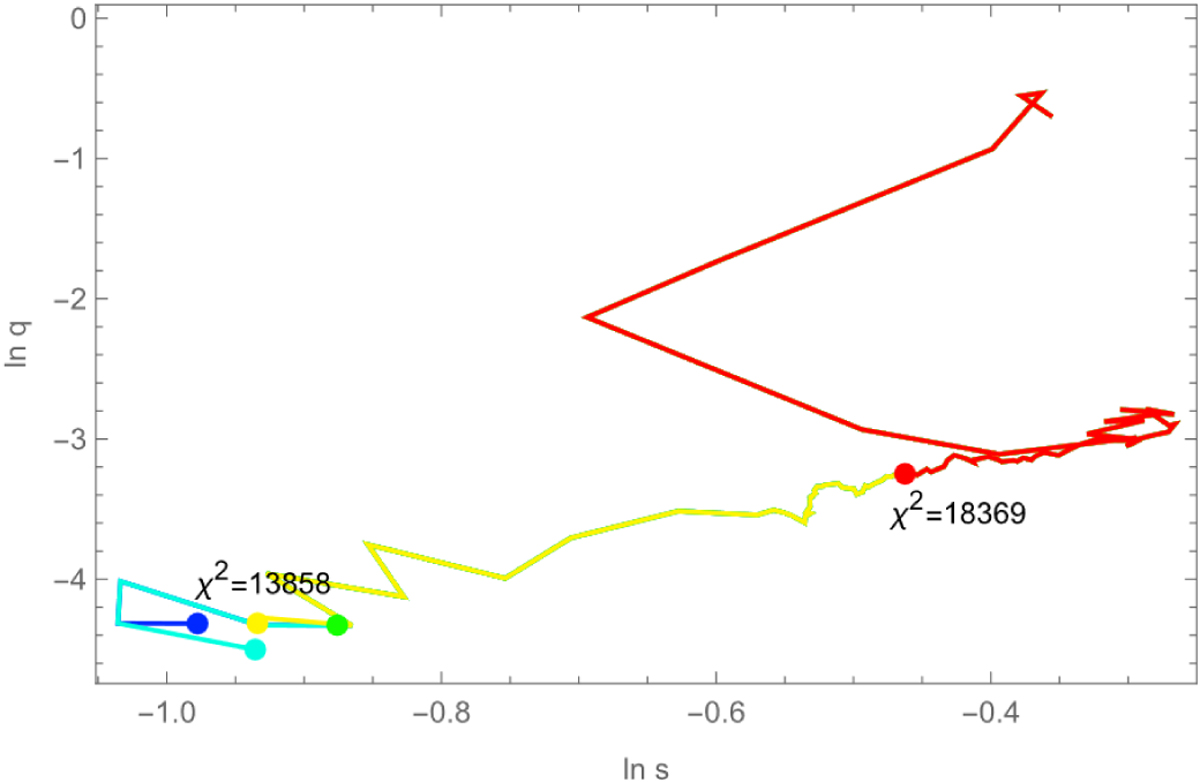
Fit track obtained on some simulated data projected to the plane (ln s, ln q) in a binary-lens fit. We see that the first fit (red track) ended at a local minimum with high χ2. Then, repeating the fit with the bumper mechanism leads to a different region with a much lower χ2, where some more minima are found.
Current usage metrics show cumulative count of Article Views (full-text article views including HTML views, PDF and ePub downloads, according to the available data) and Abstracts Views on Vision4Press platform.
Data correspond to usage on the plateform after 2015. The current usage metrics is available 48-96 hours after online publication and is updated daily on week days.
Initial download of the metrics may take a while.