Fig. 6.
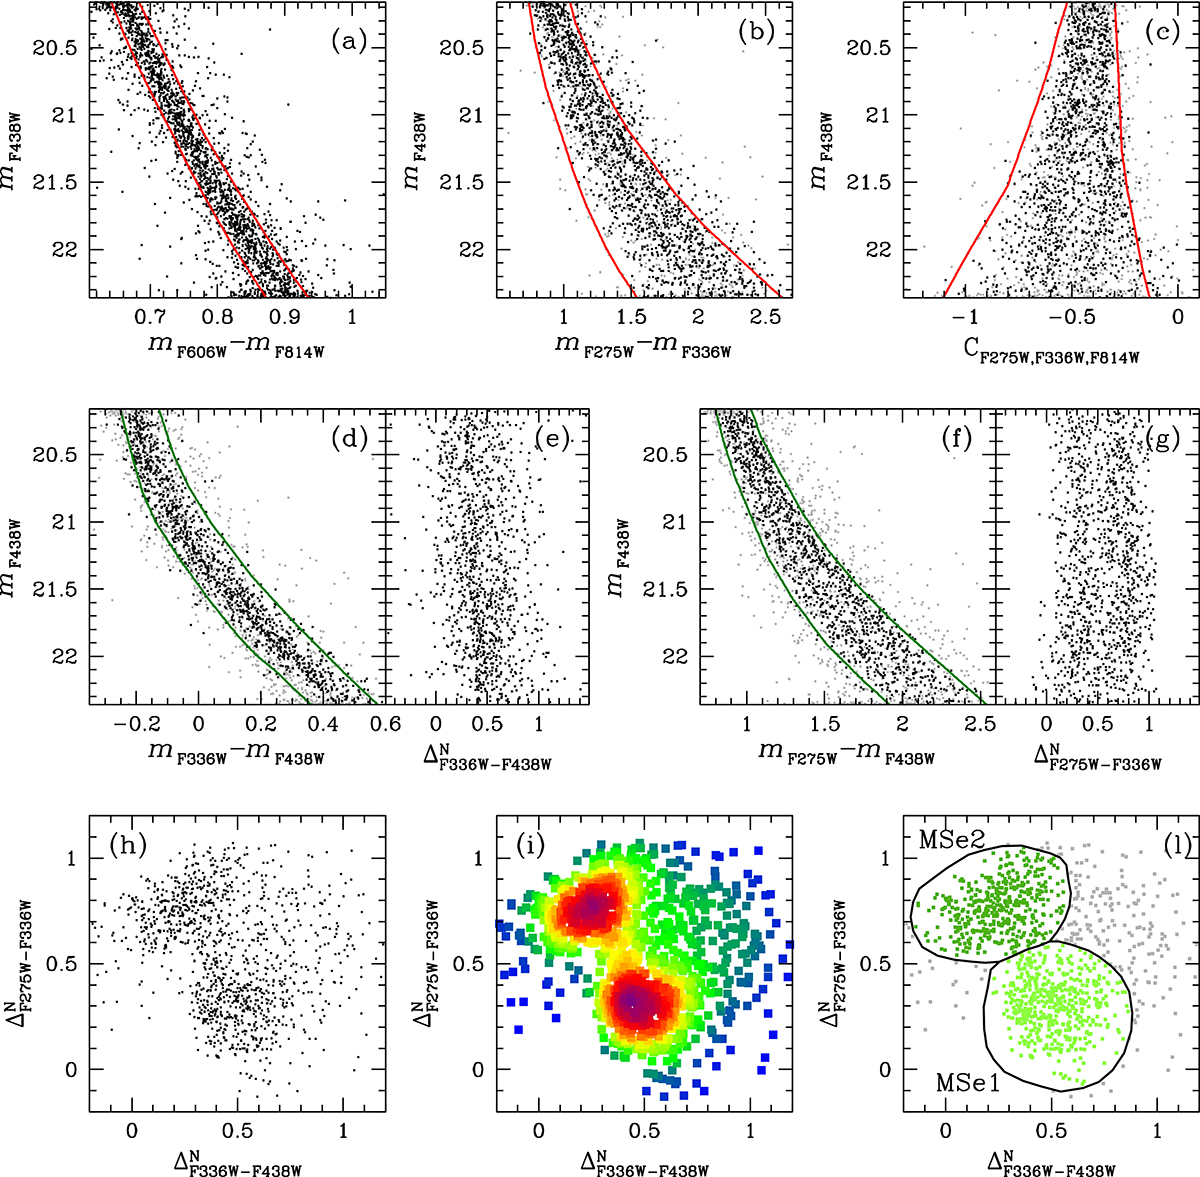
Download original image
(a) Same as panel (b) of Fig. 5, but MSd stars are also removed. The remaining stars, constituting the MSe population, form a well-defined sequence on this plane, which we select and further refine in panels (b) and (c). (d)-(f) Fiducials (in green) used to verticalise the MSe sequences. (e)-(g) Verticalised CMDs. (h)-(i) TpCD and the Hess diagram of MSe stars. (l) We identified the two MSe populations as MSe1 (lime) and MSe2 (green).
Current usage metrics show cumulative count of Article Views (full-text article views including HTML views, PDF and ePub downloads, according to the available data) and Abstracts Views on Vision4Press platform.
Data correspond to usage on the plateform after 2015. The current usage metrics is available 48-96 hours after online publication and is updated daily on week days.
Initial download of the metrics may take a while.