Fig. 2.
Download original image
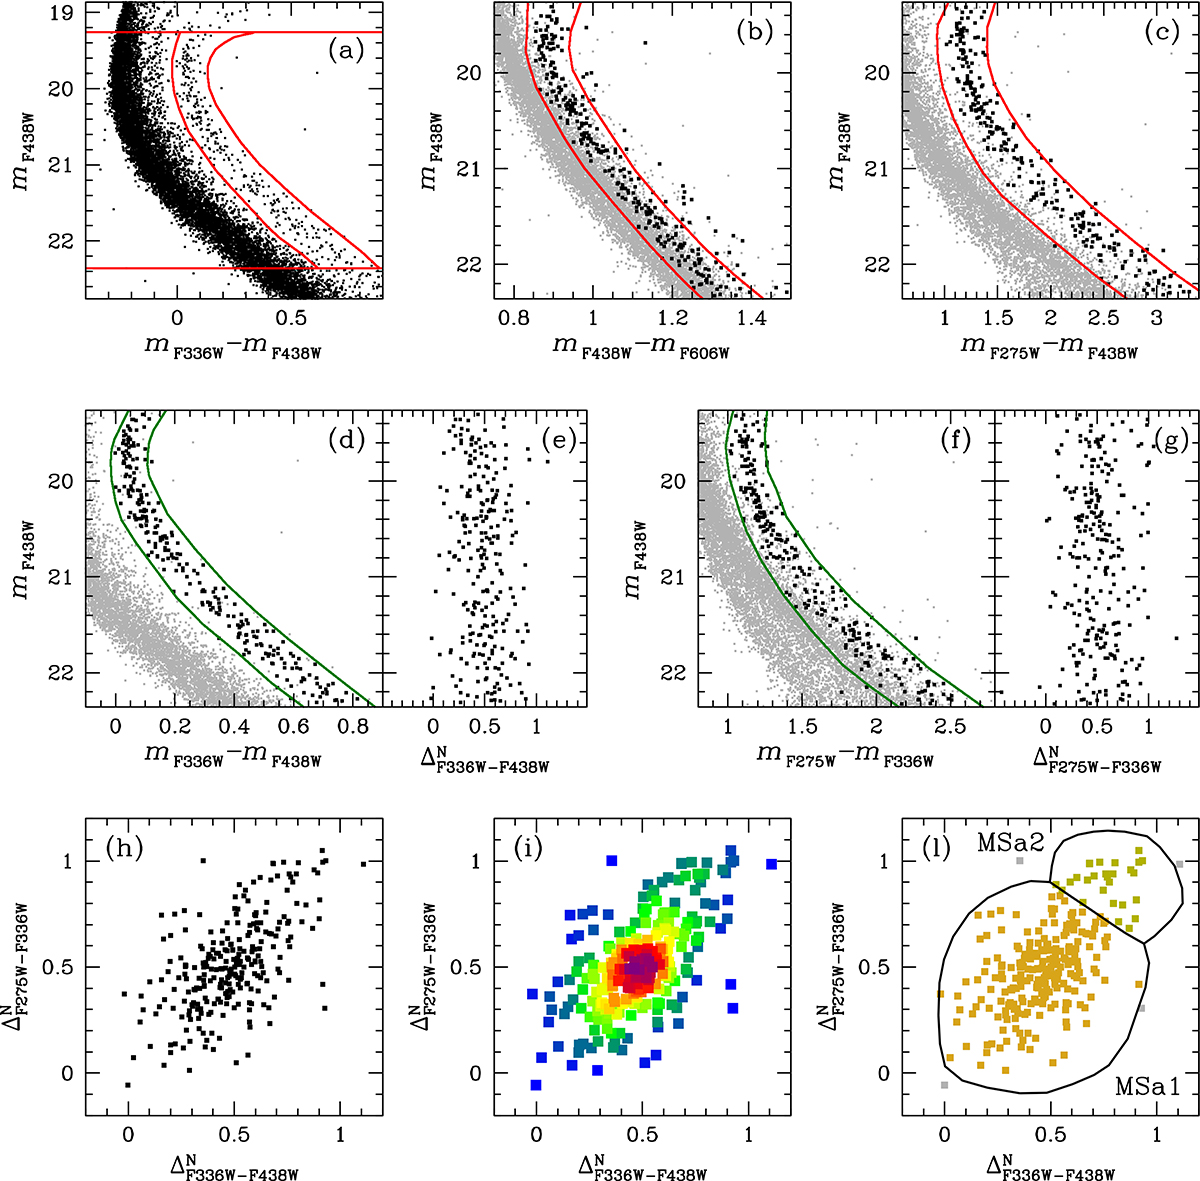
Illustration of the selection procedures we applied to isolate MSa stars. (a) Preliminary selection of MSa candidates on the mF336W − mF438W CMD (within the red lines). (b)-(c) Selection refinements using two CMDs of different colours. We show MSa stars selected from the previous panel in black and, the rest of the MS in grey. Rejected stars are those outside the two red lines. (d) Fiducial lines (in green) used to verticalise the MSa in the mF336W − mF438W CMD. Stars that survived the selections from panels (a)+(b)+(c) are represented in black, while other stars are in grey. (e) Verticalised ![]() CMD. (f)-(g) Same as panels (d) and (e) but for the mF275W − mF336W CMD. (h)
CMD. (f)-(g) Same as panels (d) and (e) but for the mF275W − mF336W CMD. (h) ![]() versus
versus ![]() TpCD of MSa stars. (e) Hess diagram of the TpCD. (f) The two defined MSa subpopulations: MSa1 (in dark yellow) and MSa2 (in light yellow).
TpCD of MSa stars. (e) Hess diagram of the TpCD. (f) The two defined MSa subpopulations: MSa1 (in dark yellow) and MSa2 (in light yellow).
Current usage metrics show cumulative count of Article Views (full-text article views including HTML views, PDF and ePub downloads, according to the available data) and Abstracts Views on Vision4Press platform.
Data correspond to usage on the plateform after 2015. The current usage metrics is available 48-96 hours after online publication and is updated daily on week days.
Initial download of the metrics may take a while.