Open Access
Fig. A.1
Download original image
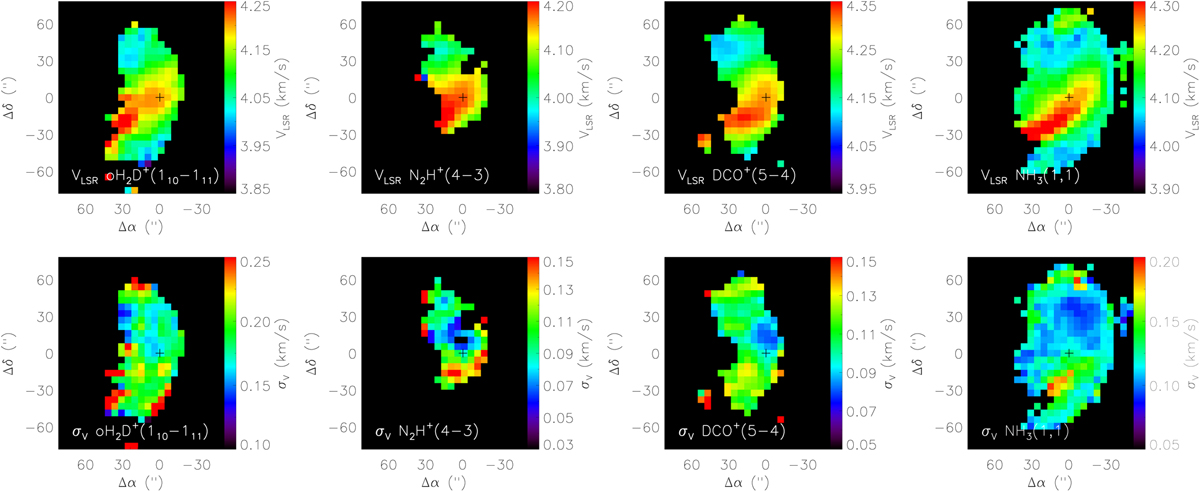
Distributions of the centroid LSR velocities and velocity dispersions of the lines observed towards H-MM1. Points with low signal-to-noise ratios are excluded. The right hand panel shows results from the VLA NH3 mapping by Pineda et al. (2022), resampled to the grid used for the LAsMA maps.
Current usage metrics show cumulative count of Article Views (full-text article views including HTML views, PDF and ePub downloads, according to the available data) and Abstracts Views on Vision4Press platform.
Data correspond to usage on the plateform after 2015. The current usage metrics is available 48-96 hours after online publication and is updated daily on week days.
Initial download of the metrics may take a while.