Open Access
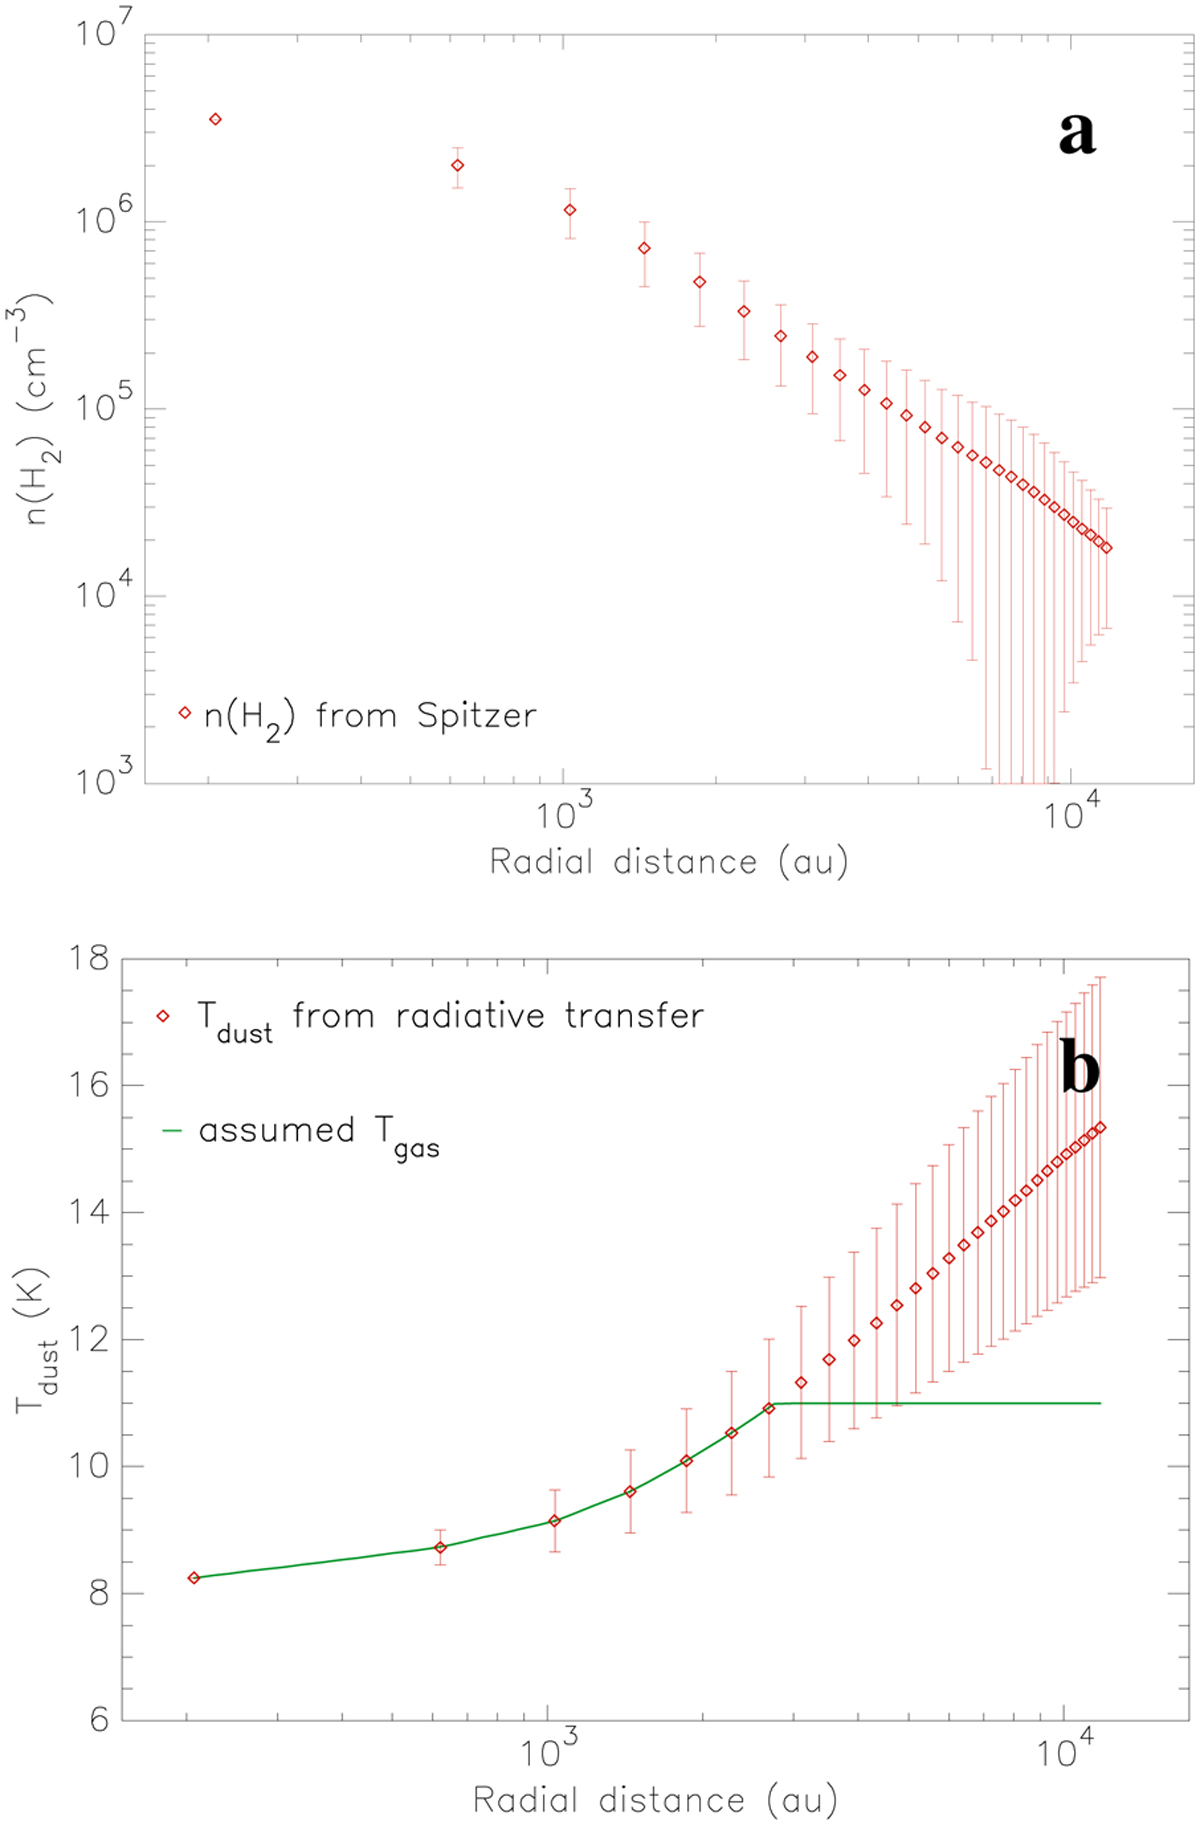
Fig. 6
Download original image
Density and dust temperature distributions in the core model as functions of the distance from the density peak. The squares and error bars show the mean values and standard deviations in concentric spherical shells. The assumed gas temperature profile is shown with green in the bottom panel.
Current usage metrics show cumulative count of Article Views (full-text article views including HTML views, PDF and ePub downloads, according to the available data) and Abstracts Views on Vision4Press platform.
Data correspond to usage on the plateform after 2015. The current usage metrics is available 48-96 hours after online publication and is updated daily on week days.
Initial download of the metrics may take a while.