Fig. E.1
Download original image
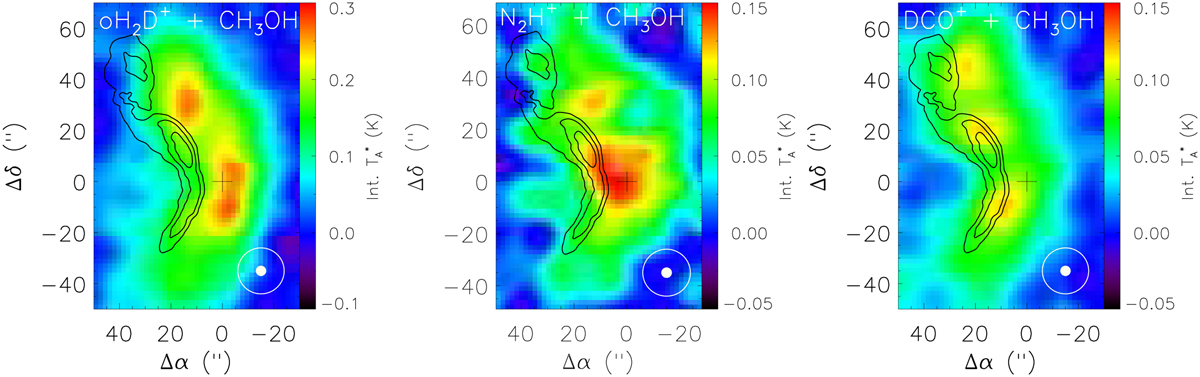
Integrated CH3OH(2k − 1k) line intensity contours superimposed on the oH2D+(110 −111) N2H+(4 − 3), and DCO+(5 − 4) maps of H-MM1. The contour levels are 2, 3, and 4 K km s−1 (on the TB scale). The methanol observations at 96.7 GHz are from ALMA and have an angular resolution of 4″. The colour scales of the pixel images are the same as in Fig. 3. The APEX and ALMA beams are shown in the bottom right.
Current usage metrics show cumulative count of Article Views (full-text article views including HTML views, PDF and ePub downloads, according to the available data) and Abstracts Views on Vision4Press platform.
Data correspond to usage on the plateform after 2015. The current usage metrics is available 48-96 hours after online publication and is updated daily on week days.
Initial download of the metrics may take a while.