Fig. D.1
Download original image
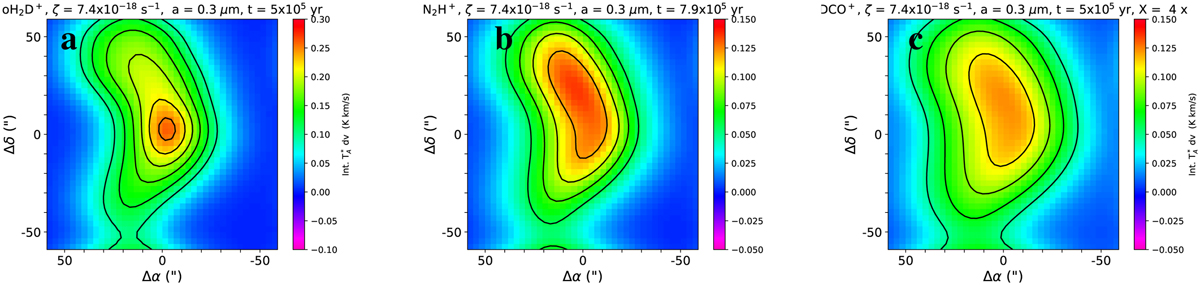
Integrated oH2D+(110 − 111) N2H+(4 − 3), and DCO+(5 − 4) maps from a model where the grain radius is assumed to be a = 0.3 µm. This model approximately reproduces the observed oH2D+ and N2H+ line intensities but underpredicts the DCO+ intensity. In the core model shown in the figure, the fractional DCO+ abundance is multiplied by 4. The simulation times are shown in the titles of the images.
Current usage metrics show cumulative count of Article Views (full-text article views including HTML views, PDF and ePub downloads, according to the available data) and Abstracts Views on Vision4Press platform.
Data correspond to usage on the plateform after 2015. The current usage metrics is available 48-96 hours after online publication and is updated daily on week days.
Initial download of the metrics may take a while.