Fig. C.2
Download original image
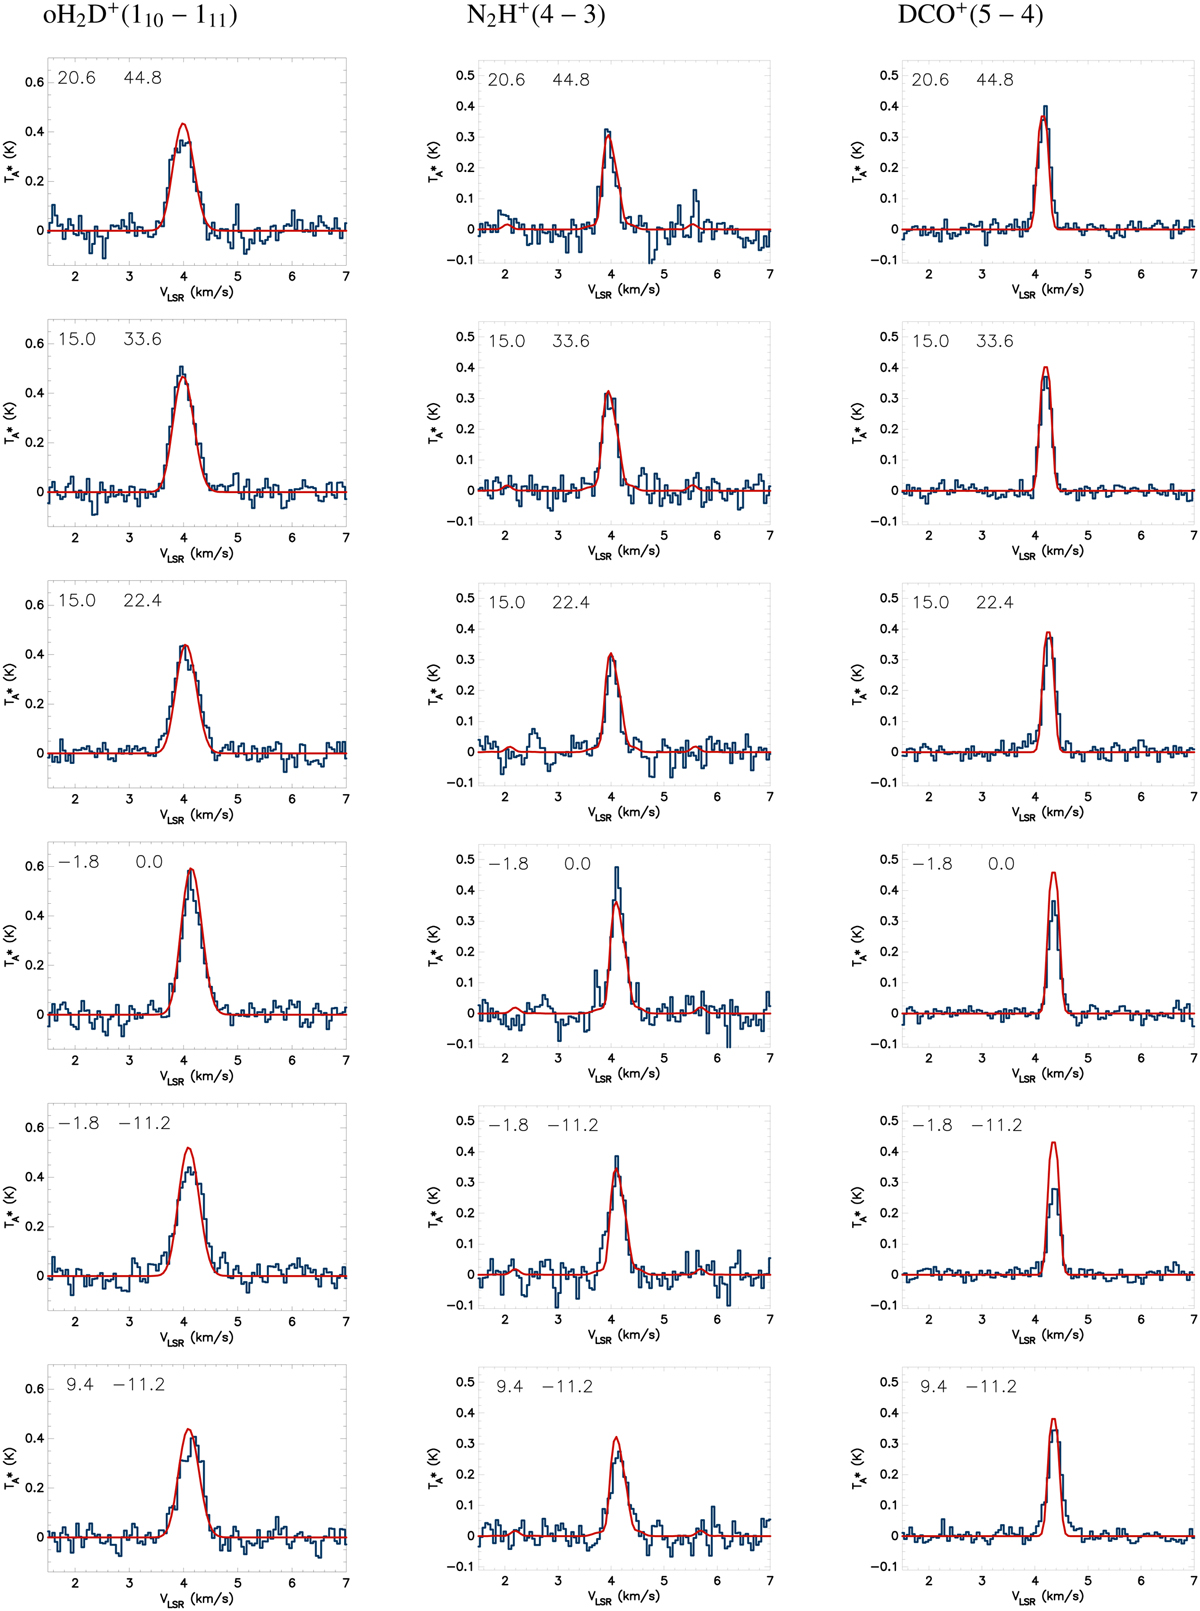
Observed and modelled oH2D+(110 − 111) (left), N2H+(4 − 3) (middle), and DCO+(5 − 4) (right) spectra towards selected positions in H-MM1. The positions are indicated with square markers on the maps in Fig. C.1. The model spectra are shown in red. The offsets are with respect to the column density peak of the core. The model is the same as in Fig. C.1, and the scaling factors of the N2H+ and DCO+ abundances are also the same. The intensity scale is ![]() .
.
Current usage metrics show cumulative count of Article Views (full-text article views including HTML views, PDF and ePub downloads, according to the available data) and Abstracts Views on Vision4Press platform.
Data correspond to usage on the plateform after 2015. The current usage metrics is available 48-96 hours after online publication and is updated daily on week days.
Initial download of the metrics may take a while.