Fig. 7
Download original image
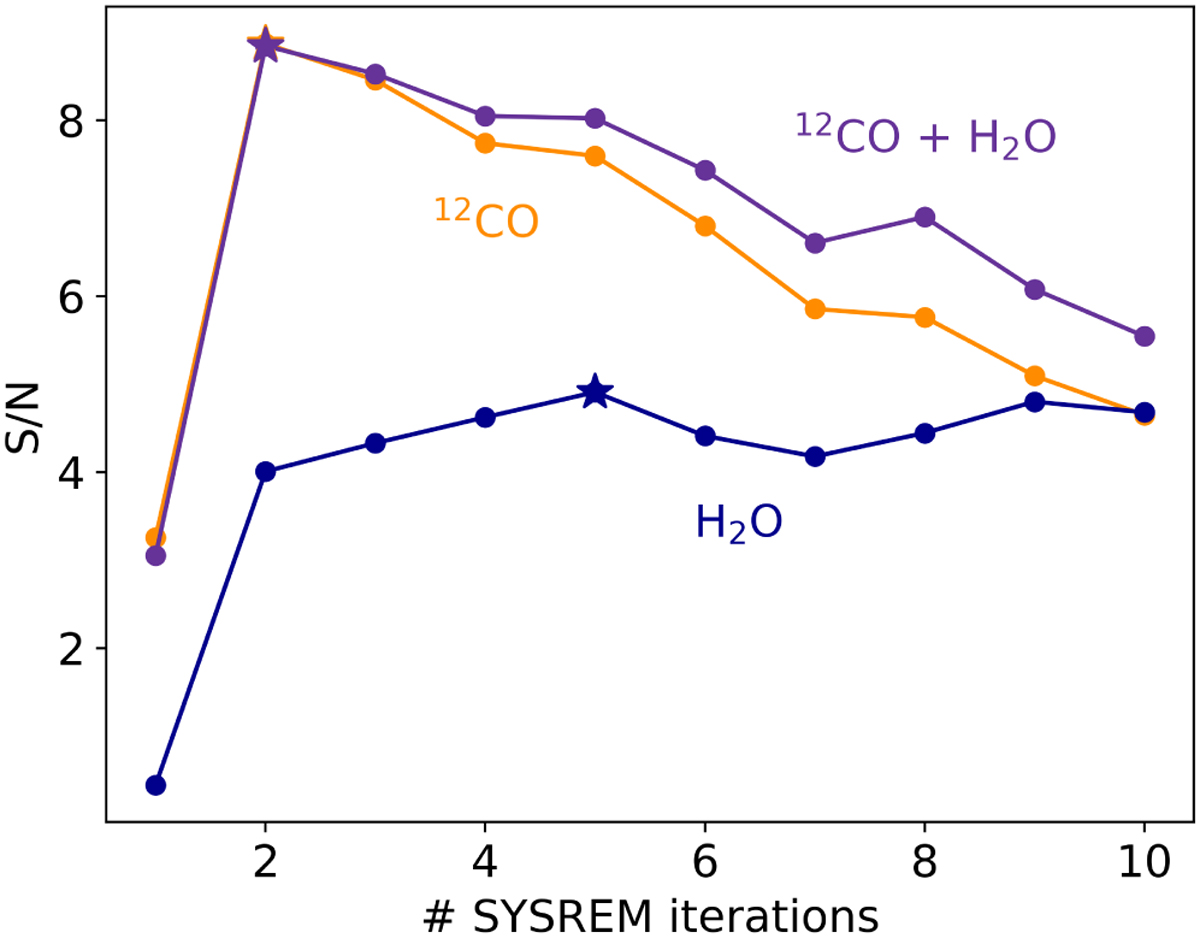
S/N values as a function of SYSREM iterations. We show the detection strengths obtained from cross-correlation with model spectra including the emission lines of 12CO, H2O, and both species together, respectively. The iteration with the most significant S/N peak is indicated by the star symbol. In our retrieval framework in Sec. 5, we used the iteration number that yields the most prominent S/N detection peak of the species-combined signal, i.e., two consecutive SYSREM iterations.
Current usage metrics show cumulative count of Article Views (full-text article views including HTML views, PDF and ePub downloads, according to the available data) and Abstracts Views on Vision4Press platform.
Data correspond to usage on the plateform after 2015. The current usage metrics is available 48-96 hours after online publication and is updated daily on week days.
Initial download of the metrics may take a while.