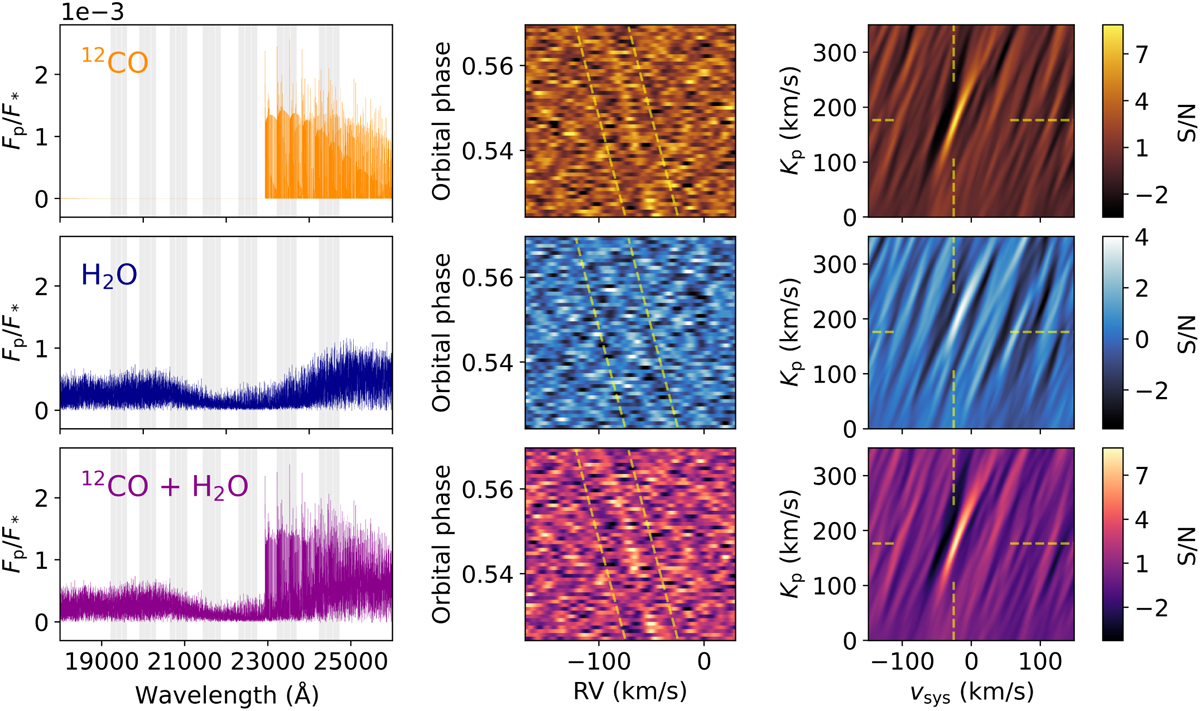
Fig. 5
Download original image
Spectral models, CCF maps, and S/N maps of 12CO, H2O, and both species together. The left panels show the continuum normalized model spectra. Wavelengths covered by the CRIRES+ K2166 setting used in this work are indicated by the gray shaded area. The middle panels illustrate the CCF maps. The spectral signal from WASP-178b’s atmosphere can be identified as a diagonal trail. The expected RV evolution as a function of orbital phase is indicated by the yellow dashed lines. The right panels show the S/N maps. The expected position of the planetary signal is indicated by the yellow dashed lines. We show the CCF maps and S/N maps corresponding to two consecutive runs of SYSREM, which is the number of iterations used in the retrieval in Sec. 5.
Current usage metrics show cumulative count of Article Views (full-text article views including HTML views, PDF and ePub downloads, according to the available data) and Abstracts Views on Vision4Press platform.
Data correspond to usage on the plateform after 2015. The current usage metrics is available 48-96 hours after online publication and is updated daily on week days.
Initial download of the metrics may take a while.