Fig. 3
Download original image
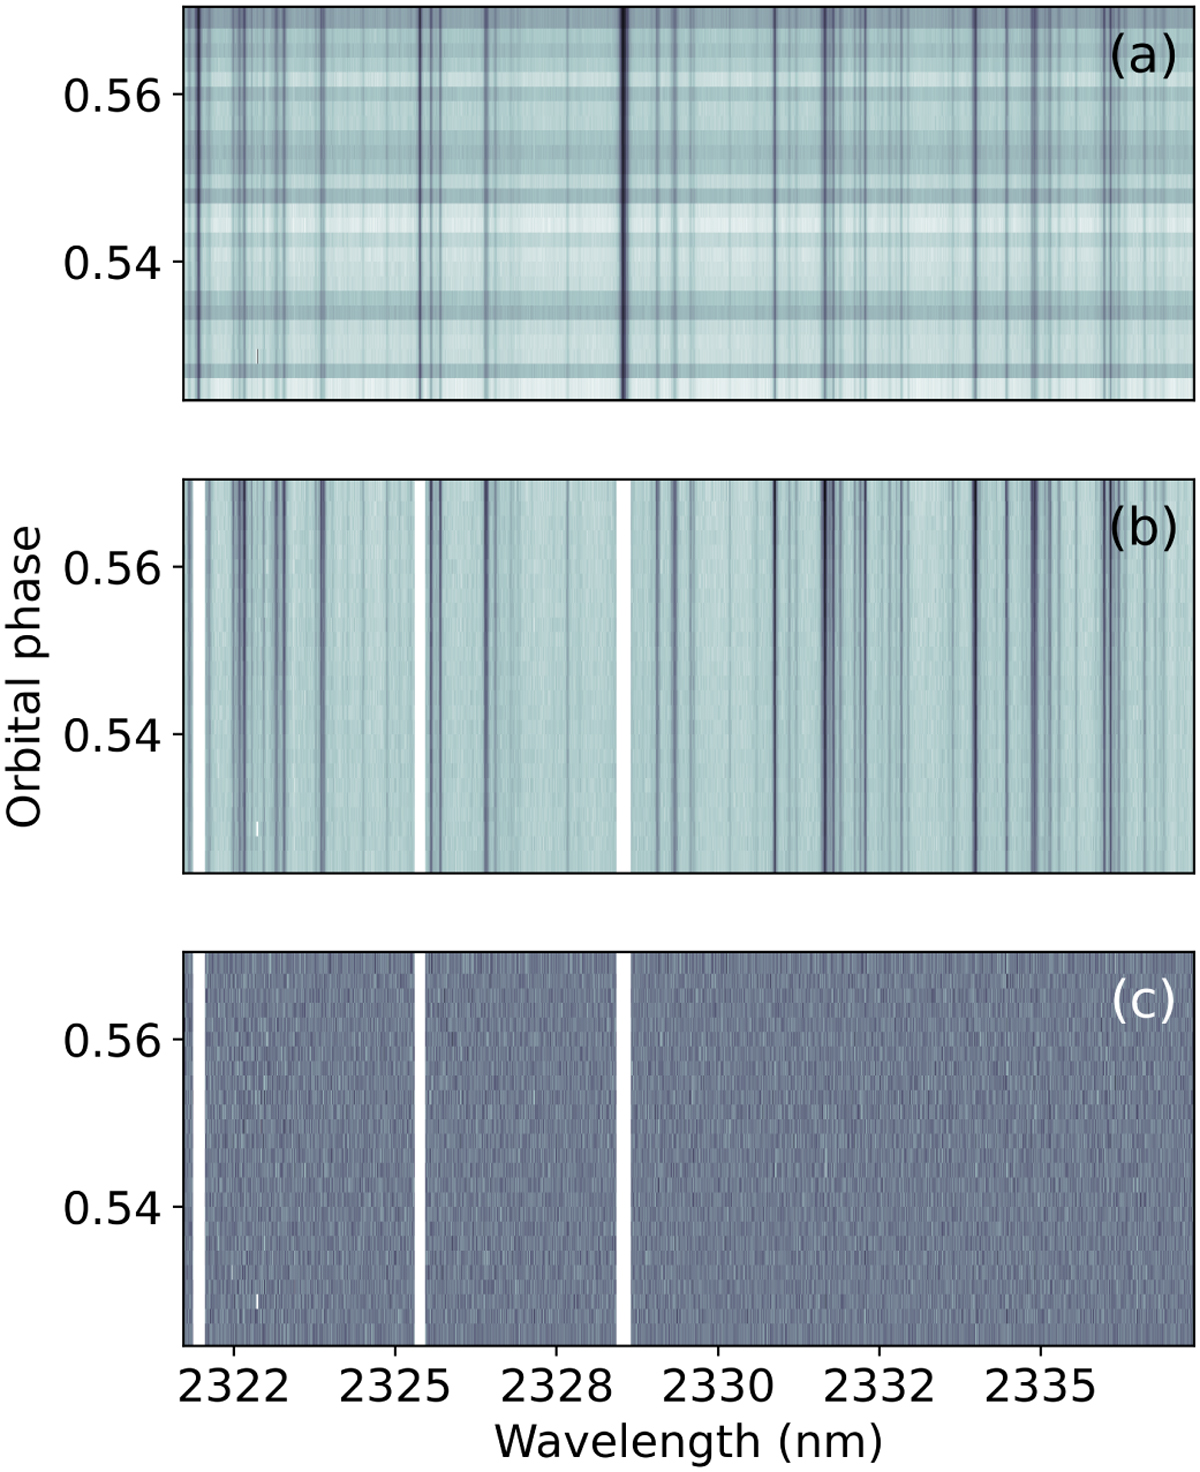
Overview of data reduction procedures for a representative CRIRES+ wavelength range. Panel a: raw spectral matrix after extraction of the one-dimensional spectra. Panel b: spectral matrix after normalization, outlier correction, and masking of the strongest telluric features. Panel c: residual spectral matrix after removal of telluric and stellar lines via two consecutive SYSREM iterations.
Current usage metrics show cumulative count of Article Views (full-text article views including HTML views, PDF and ePub downloads, according to the available data) and Abstracts Views on Vision4Press platform.
Data correspond to usage on the plateform after 2015. The current usage metrics is available 48-96 hours after online publication and is updated daily on week days.
Initial download of the metrics may take a while.