Fig. A.1
Download original image
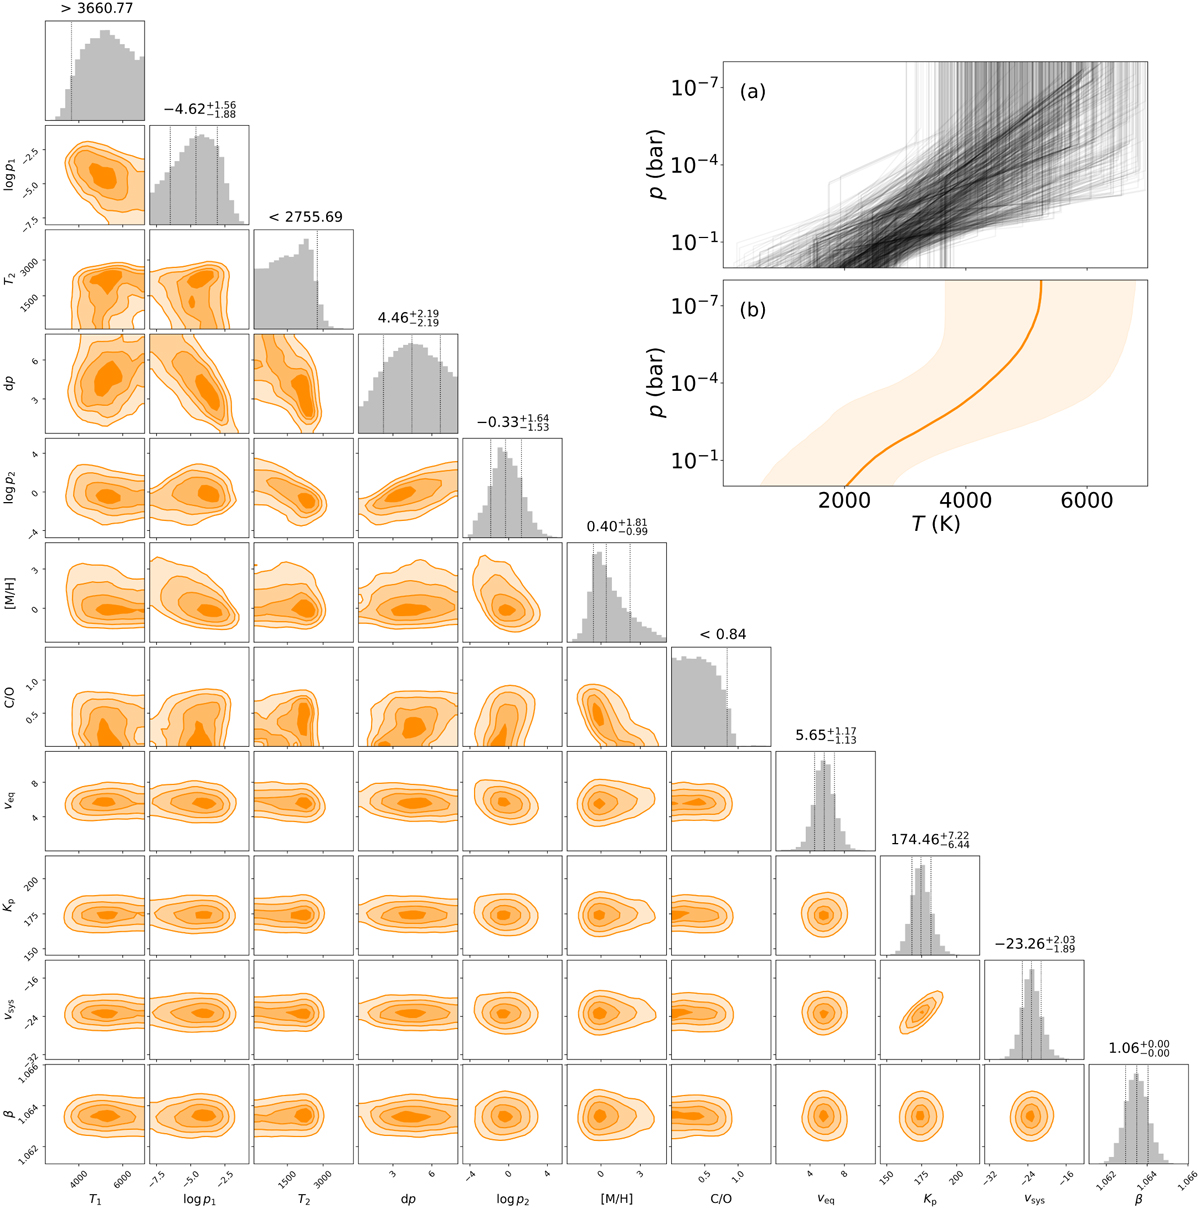
Results of high-resolution retrieval. Corner plot: posterior distributions and correlations between the atmospheric parameters. The dashed vertical lines in the posterior distributions denote the median and 1σ intervals for the bounded parameters. For parameters with upper or lower limits, we report the 2σ intervals. Panel a: examples of the T-p profiles sampled by the MCMC analysis, showing that the bottom of the thermal inversion is poorly constrained. Panel b: median temperature curve with 95 percentiles derived from 3000 random posterior draws.
Current usage metrics show cumulative count of Article Views (full-text article views including HTML views, PDF and ePub downloads, according to the available data) and Abstracts Views on Vision4Press platform.
Data correspond to usage on the plateform after 2015. The current usage metrics is available 48-96 hours after online publication and is updated daily on week days.
Initial download of the metrics may take a while.