Fig. 13
Download original image
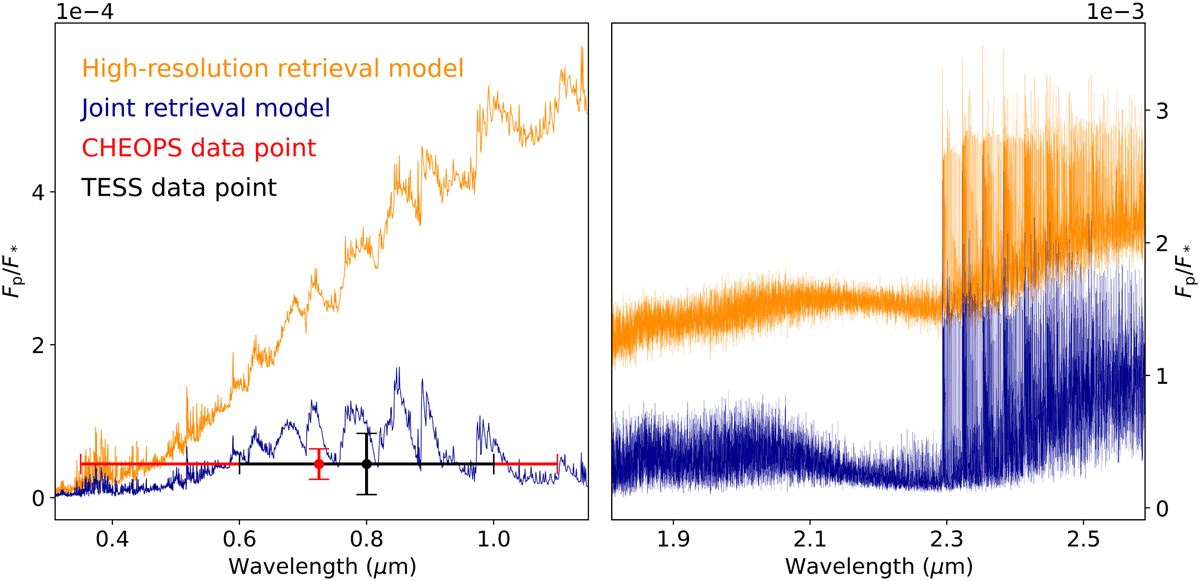
Comparison of model spectra obtained from best-fit parameters of the retrievals. Left panel: low-resolution model spectra before integration over the TESS and CHEOPS bandpasses. The parameters derived from the high-resolution retrieval on the CRIRES+ data alone cannot constrain the planetary emission spectrum in the TESS and CHEOPS wavelength range, while the model obtained from the joint retrieval is in agreement with the photometric data points. We note that the plotted eclipse depths are corrected for their reflection component via the retrieved geometric albedo value, since the reported model spectra only consider thermal emission. Right panel: high-resolution model spectra at CRIRES+ wavelengths. Except for the different continuum level, the two models strongly resemble each other.
Current usage metrics show cumulative count of Article Views (full-text article views including HTML views, PDF and ePub downloads, according to the available data) and Abstracts Views on Vision4Press platform.
Data correspond to usage on the plateform after 2015. The current usage metrics is available 48-96 hours after online publication and is updated daily on week days.
Initial download of the metrics may take a while.