Fig. 12
Download original image
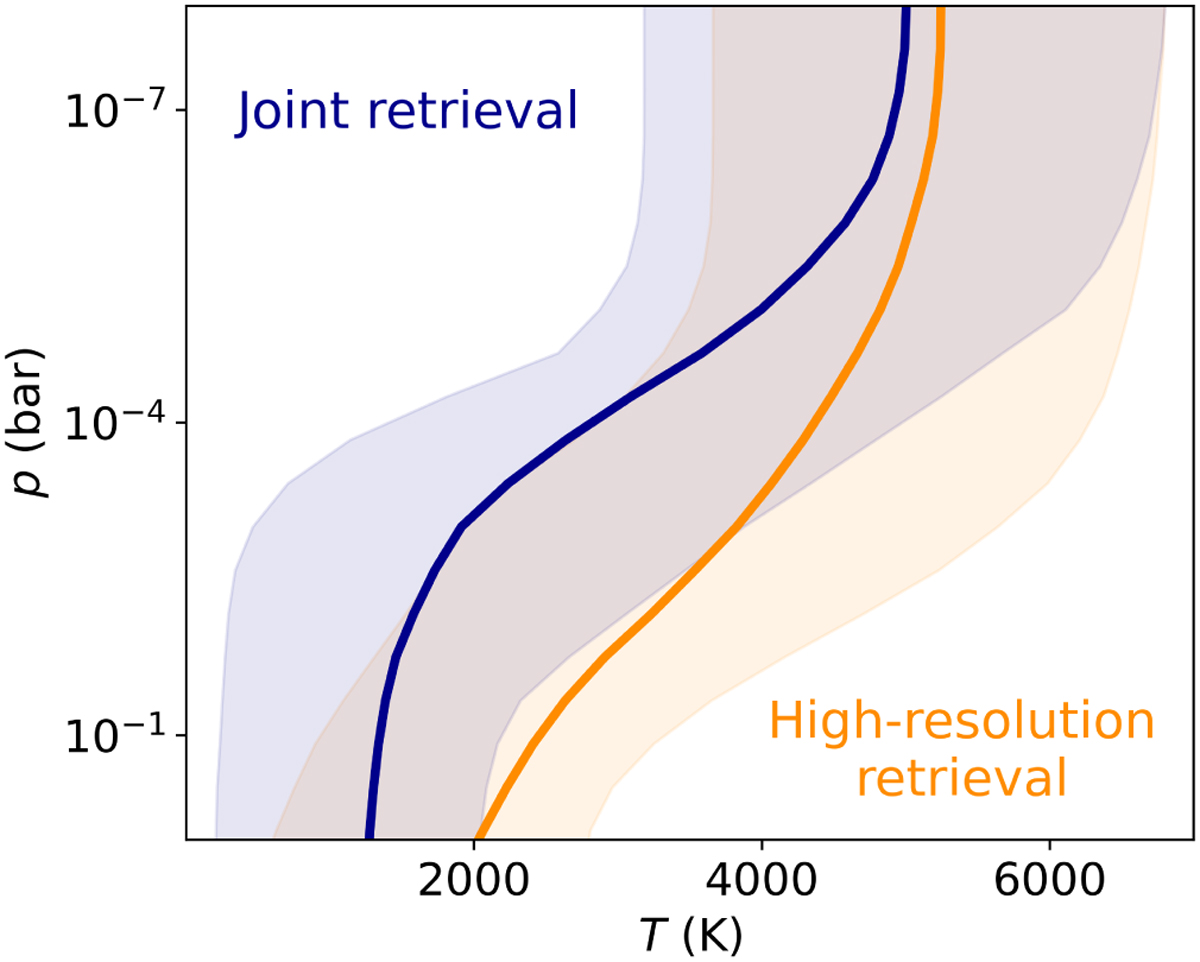
Comparison of retrieved T-p profiles. The temperature profile inferred by the high-resolution CRIRES+ retrieval is shown in orange, the temperature profile derived from the joint retrieval with TESS and CHEOPS data is shown in blue. The solid lines correspond to the median, the shaded area to the 95 percentile intervals of the sampled temperature profiles.
Current usage metrics show cumulative count of Article Views (full-text article views including HTML views, PDF and ePub downloads, according to the available data) and Abstracts Views on Vision4Press platform.
Data correspond to usage on the plateform after 2015. The current usage metrics is available 48-96 hours after online publication and is updated daily on week days.
Initial download of the metrics may take a while.