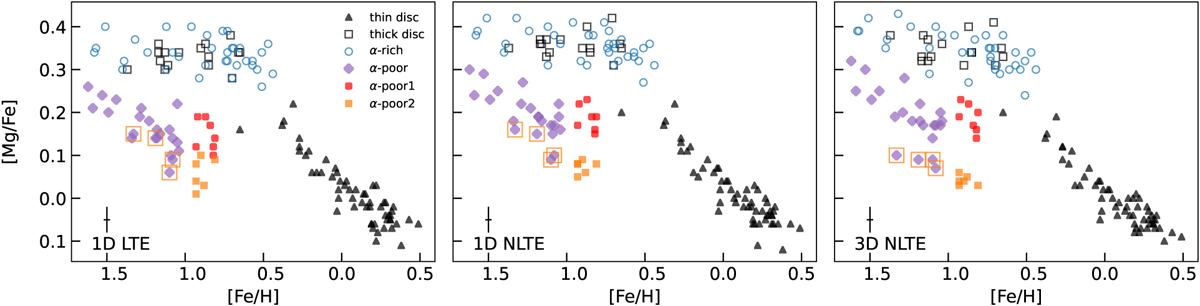
Fig. 2
Download original image
Magnesium abundances for the samples of Nissen & Schuster (2010) and Carlos et al. (in prep.) in ID LTE, ID non-LTE, and 3D non-LTE. In all panels, the Fe abundance is based on a 3D LTE analysis of Fe II lines (Amarsi et al. 2019). The metal-rich end (−1 < [Fe/H]) of the α-poor population is further divided into two, α-poor 1 and 2, based on 3D non-LTE [Mg/Fe] ratios. Four metal-poor α-poor stars are marked with open squares, as they have slightly lower [Mg/Fe] in 3D non-LTE than the other α-poor stars at the same metallicity.
Current usage metrics show cumulative count of Article Views (full-text article views including HTML views, PDF and ePub downloads, according to the available data) and Abstracts Views on Vision4Press platform.
Data correspond to usage on the plateform after 2015. The current usage metrics is available 48-96 hours after online publication and is updated daily on week days.
Initial download of the metrics may take a while.