Open Access
Fig. 7
Download original image
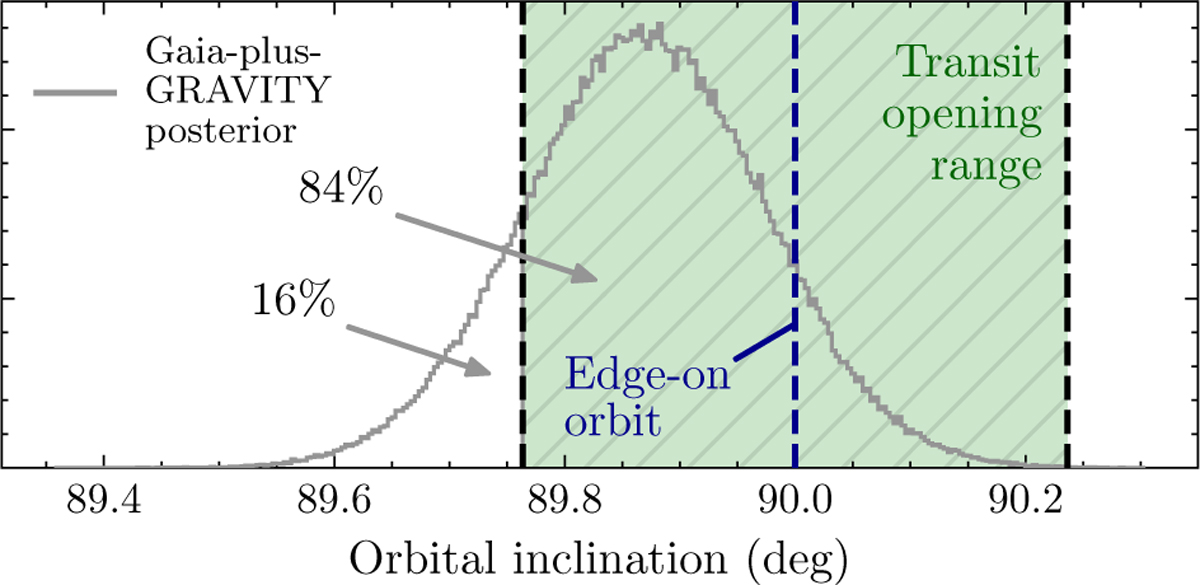
WT 766 B’s Gaia-plus-GRAVITY inclination posterior compared to the angular transit opening range indicated by the hatched green region. The dashed blue line shows a perfectly edge-on orbit. The percentage values specify the posterior sampling fractions falling within and outside the opening range.
Current usage metrics show cumulative count of Article Views (full-text article views including HTML views, PDF and ePub downloads, according to the available data) and Abstracts Views on Vision4Press platform.
Data correspond to usage on the plateform after 2015. The current usage metrics is available 48-96 hours after online publication and is updated daily on week days.
Initial download of the metrics may take a while.