Fig. 3
Download original image
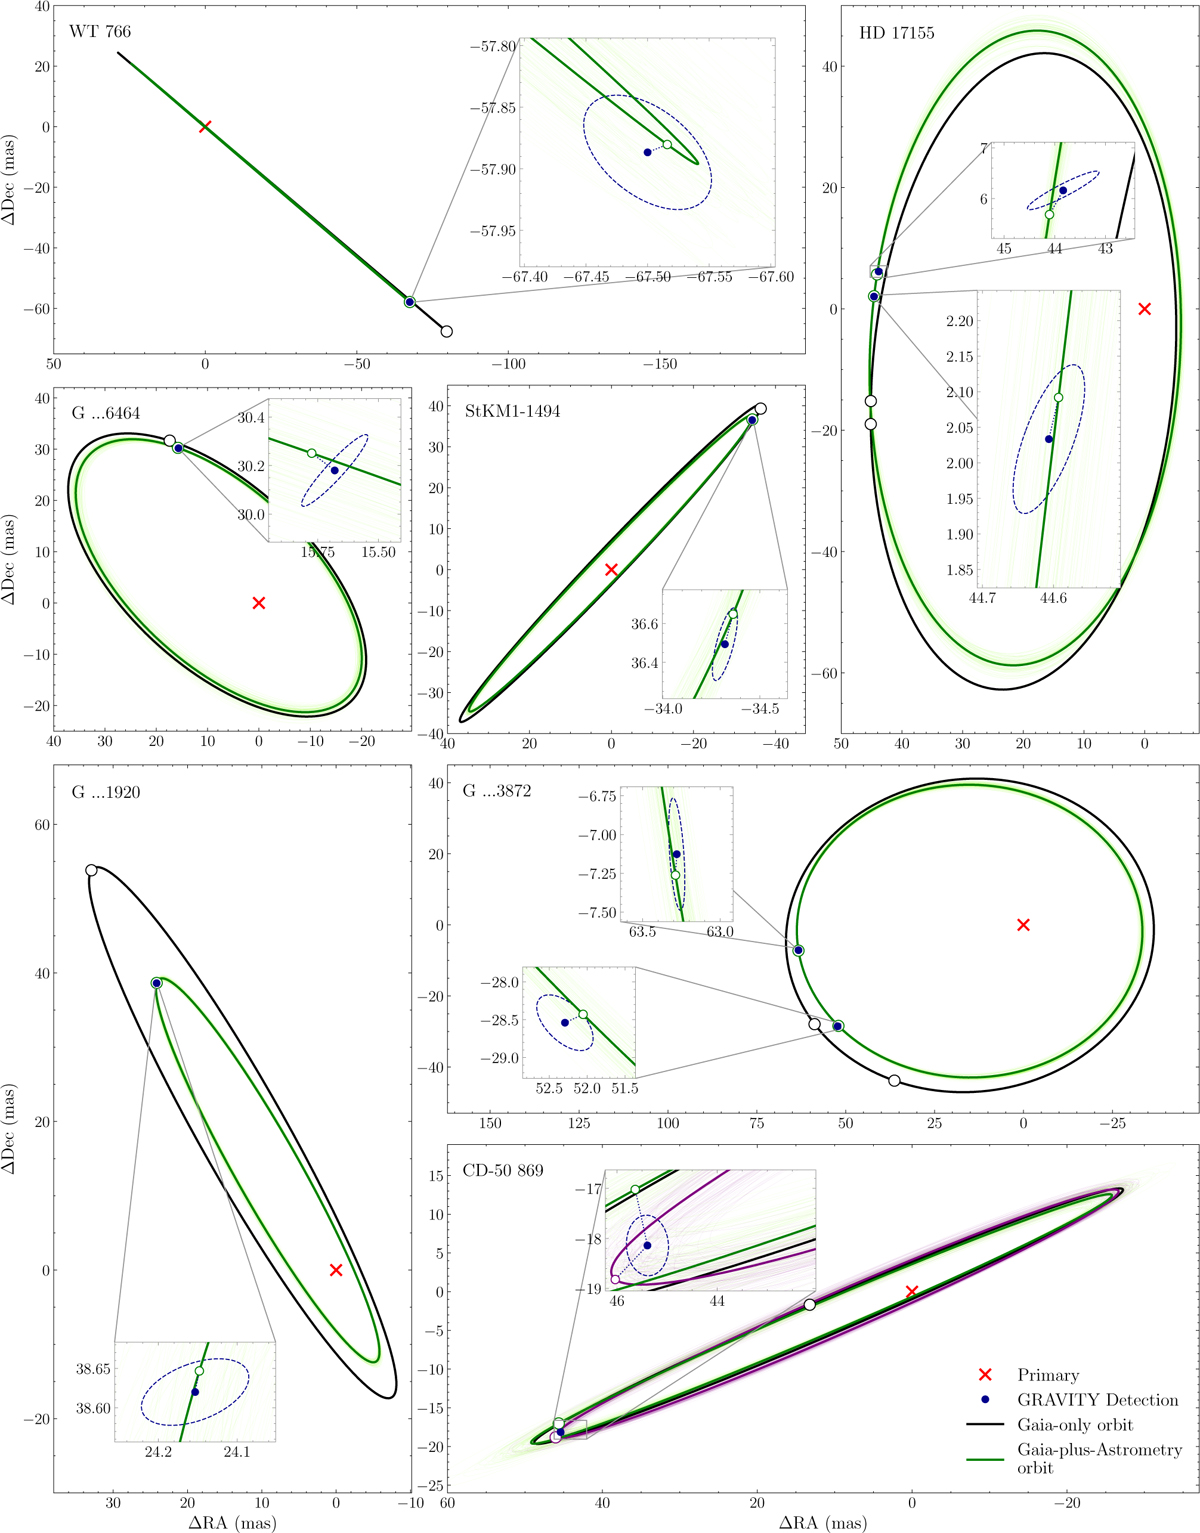
Orbits of the individual companions relative to their respective host. The black line indicates the orbit as suggested by the orbit solution listed in the Gaia NSS catalogue (assuming the lower companion mass estimate). The black circle shows where the companion was predicted to be located at the time of observation. The blue dot and its uncertainty ellipse indicate where the GRAVITY detection was made. The thick green orbit is based on the median parameter values of the posterior distributions after combining the Gaia and GRAVITY data as described in Sec. 3.1. The thin light green lines show 100 orbits drawn at random from the posterior distribution. Note that CD-50 869’s posterior orbit sampling was separated into a primary and secondary mode, shown here in green and purple, respectively.
Current usage metrics show cumulative count of Article Views (full-text article views including HTML views, PDF and ePub downloads, according to the available data) and Abstracts Views on Vision4Press platform.
Data correspond to usage on the plateform after 2015. The current usage metrics is available 48-96 hours after online publication and is updated daily on week days.
Initial download of the metrics may take a while.