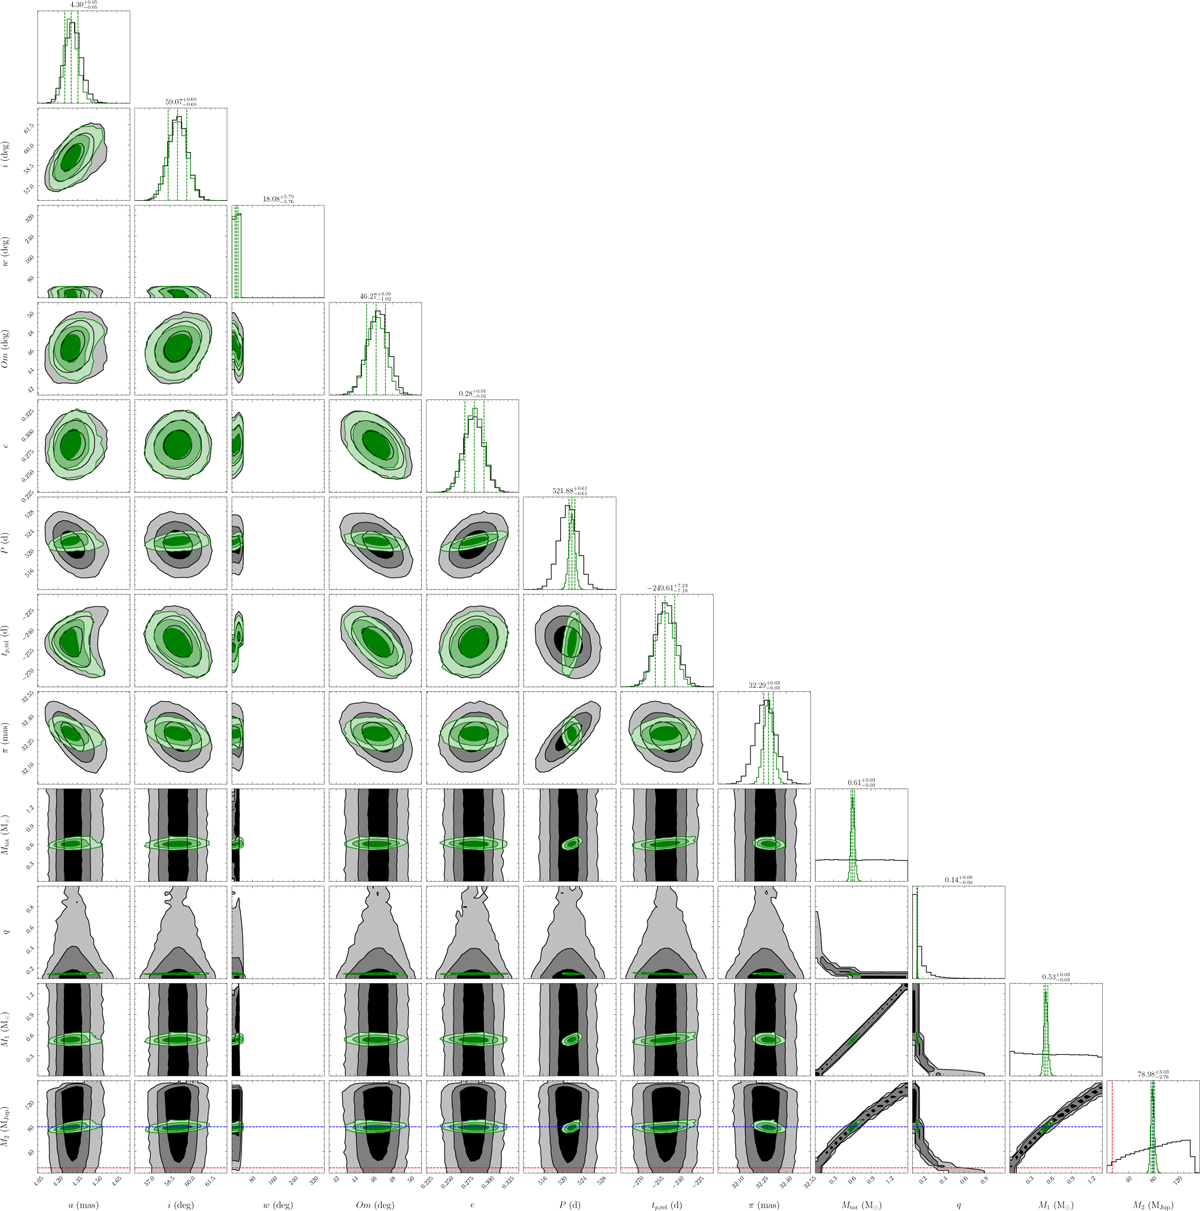
Fig. C.2
Download original image
Corner plot showing the posterior samplings for the G ...6464 system. The Gaia-only and the Gaia-plus-GRAVITY run are presented in black and green, respectively. The indices 1 denote that the shown parameters describe the host star’s orbit around the respective system’s COM. The dashed blue and red lines in the M2 row indicate the upper and lower BD mass boundaries, respectively.
Current usage metrics show cumulative count of Article Views (full-text article views including HTML views, PDF and ePub downloads, according to the available data) and Abstracts Views on Vision4Press platform.
Data correspond to usage on the plateform after 2015. The current usage metrics is available 48-96 hours after online publication and is updated daily on week days.
Initial download of the metrics may take a while.