Fig. 1
Download original image
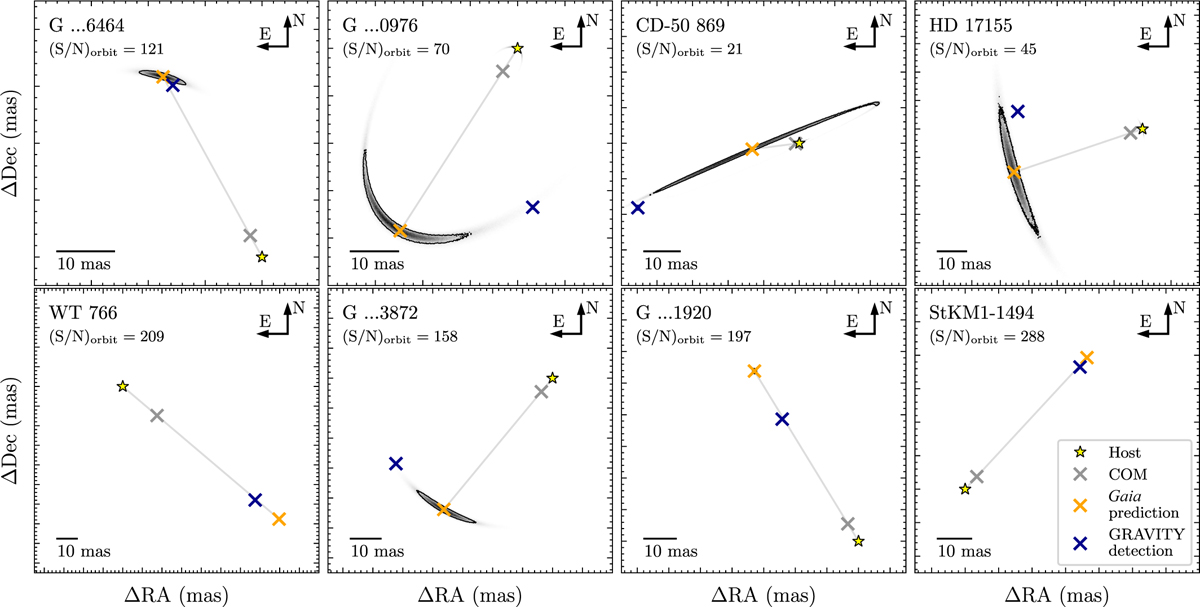
Position probability maps at the time of observation for the observed systems as computed from the respective orbital solutions listed in the Gaia NSS catalogue. The orange cross indicates the mean companion position relative to the mean host position, which is marked by the yellow star. The system’s COM is shown by the grey cross. Randomising the host and companion positions on the basis of the parameter uncertainties and correlations (while keeping the mass ratio, q, fixed to the lower limit; see the main text) yields the predicted spread around the respective mean positions. The contour line encircles 68 % of the randomised companion positions. The grey axis connects the mean host position with the mean companion position to visualise the separation’s dependence on the mass ratio, q. The position at which the companion was detected with GRAVITY is shown as the dark blue cross. For targets that were observed more than once, we show the companion position prediction corresponding to the first epoch and the resulting initial detection. The dark blue uncertainty ellipses associated with the GRAVITY detections are too small to be seen at these scales. The ticks along the panel axes are spaced by 10 mas. Finally, the significance of the individual orbital solutions, (S/N)orbit, is given below the target system name in the top-left corner of each panel.
Current usage metrics show cumulative count of Article Views (full-text article views including HTML views, PDF and ePub downloads, according to the available data) and Abstracts Views on Vision4Press platform.
Data correspond to usage on the plateform after 2015. The current usage metrics is available 48-96 hours after online publication and is updated daily on week days.
Initial download of the metrics may take a while.