Fig. 4
Download original image
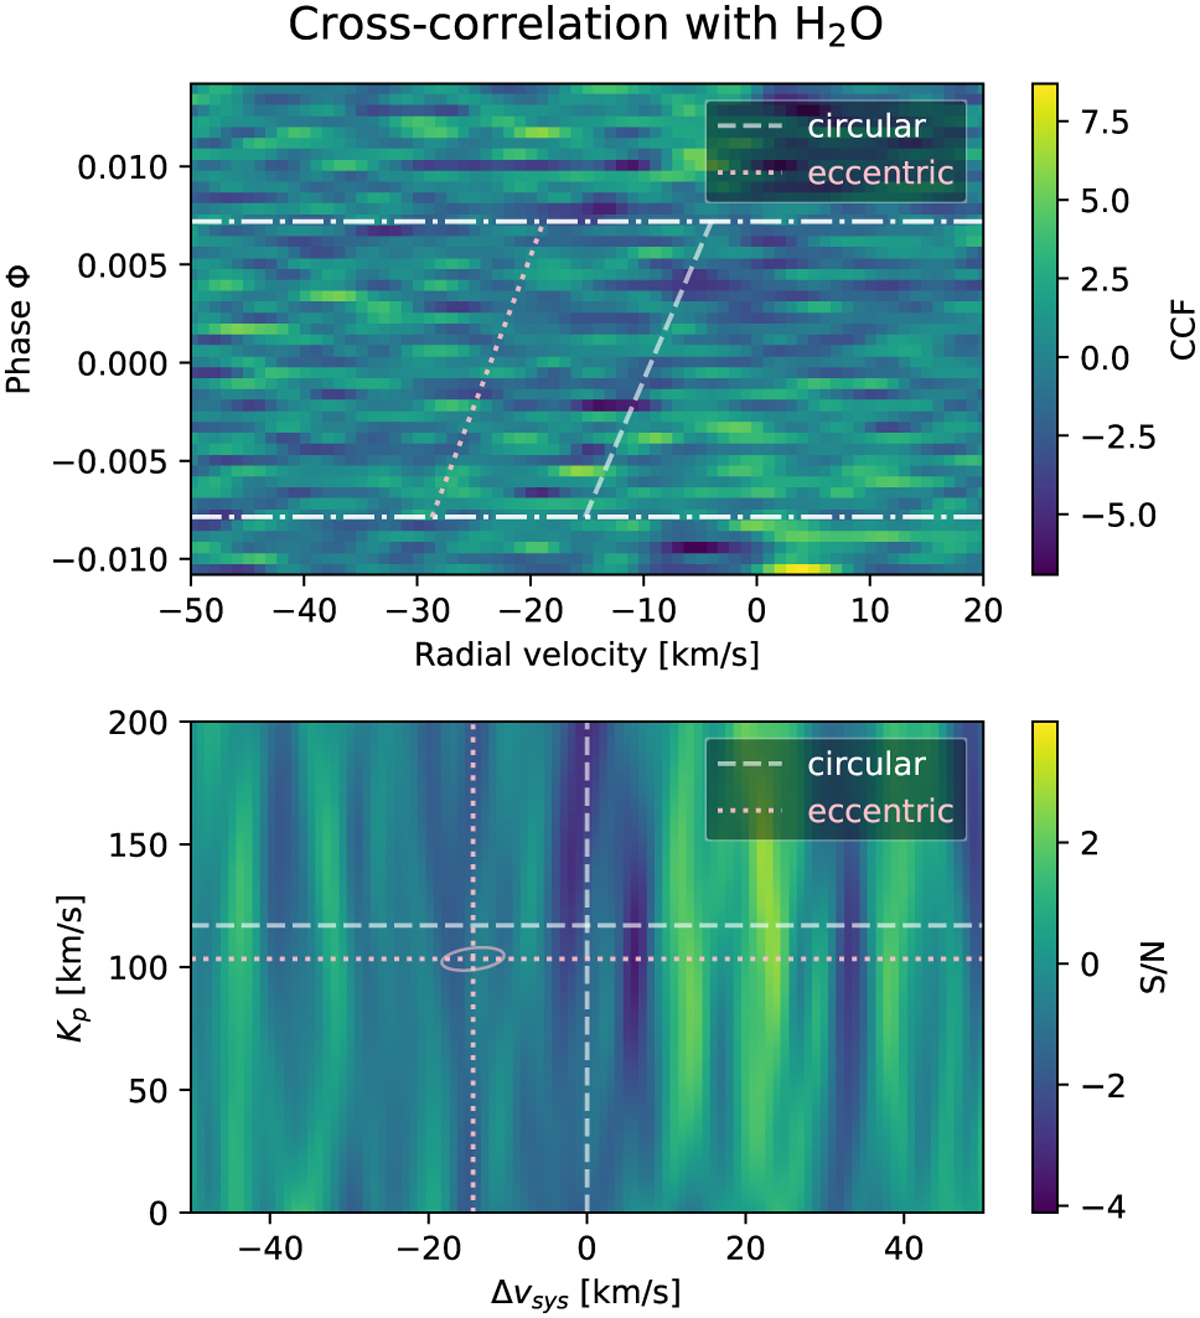
Cross-correlation strength from the H2O template with a cloud deck at 10 mbar and 10× solar metallicity, summed over all spectral orders and both nodding positions. Top panel: CCFs for each spectrum, with the radial velocity in Earth’s rest frame on the x-axis and the transit phase and corresponding exposure number on the y-axes. The horizontal dashed lines indicate the beginning and end of the transit, while the slanted lines (circular orbit in white, true eccentric orbit in pink) shows the radial velocity of the planet during its transit and hence the expected location of the signal. Bottom panel: estimated S/N as a function of the planetary rest-frame velocity υsys and radial velocity semi-amplitude Kp. The intersection of the vertical and horizontal dashed lines (circular orbit in white, true eccentric orbit in pink) indicate the location of the expected signal in the absence of atmospheric winds. The pink ellipse encompasses the Kp and radial velocity values when considering the 1-σ errors of ωp, e, and Ms.
Current usage metrics show cumulative count of Article Views (full-text article views including HTML views, PDF and ePub downloads, according to the available data) and Abstracts Views on Vision4Press platform.
Data correspond to usage on the plateform after 2015. The current usage metrics is available 48-96 hours after online publication and is updated daily on week days.
Initial download of the metrics may take a while.