Fig. 7
Download original image
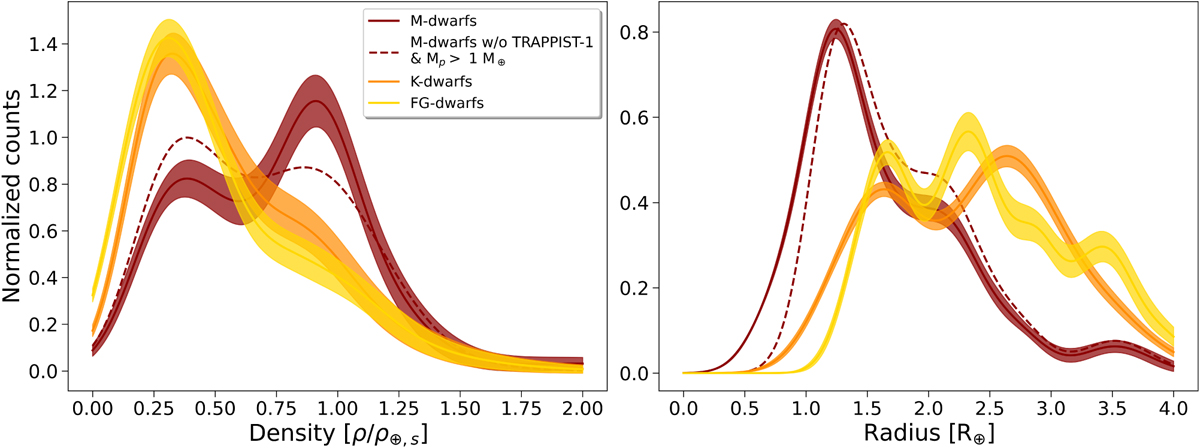
Kernel density estimates of the density (left) and radius (right) distributions of the small planets orbiting M- (red), K- (orange), and FG-dwarfs (yellow) from the PlanetS catalog. For visibility, only the resulting mean KDE (solid line) of the 10 000 realizations and its standard deviation (filled area) are plotted. The red dashed lines are the density and radius distributions of the sample orbiting M-dwarfs without the TRAPPIST-1 system and planets below 1 M⊕.
Current usage metrics show cumulative count of Article Views (full-text article views including HTML views, PDF and ePub downloads, according to the available data) and Abstracts Views on Vision4Press platform.
Data correspond to usage on the plateform after 2015. The current usage metrics is available 48-96 hours after online publication and is updated daily on week days.
Initial download of the metrics may take a while.