Fig. 6
Download original image
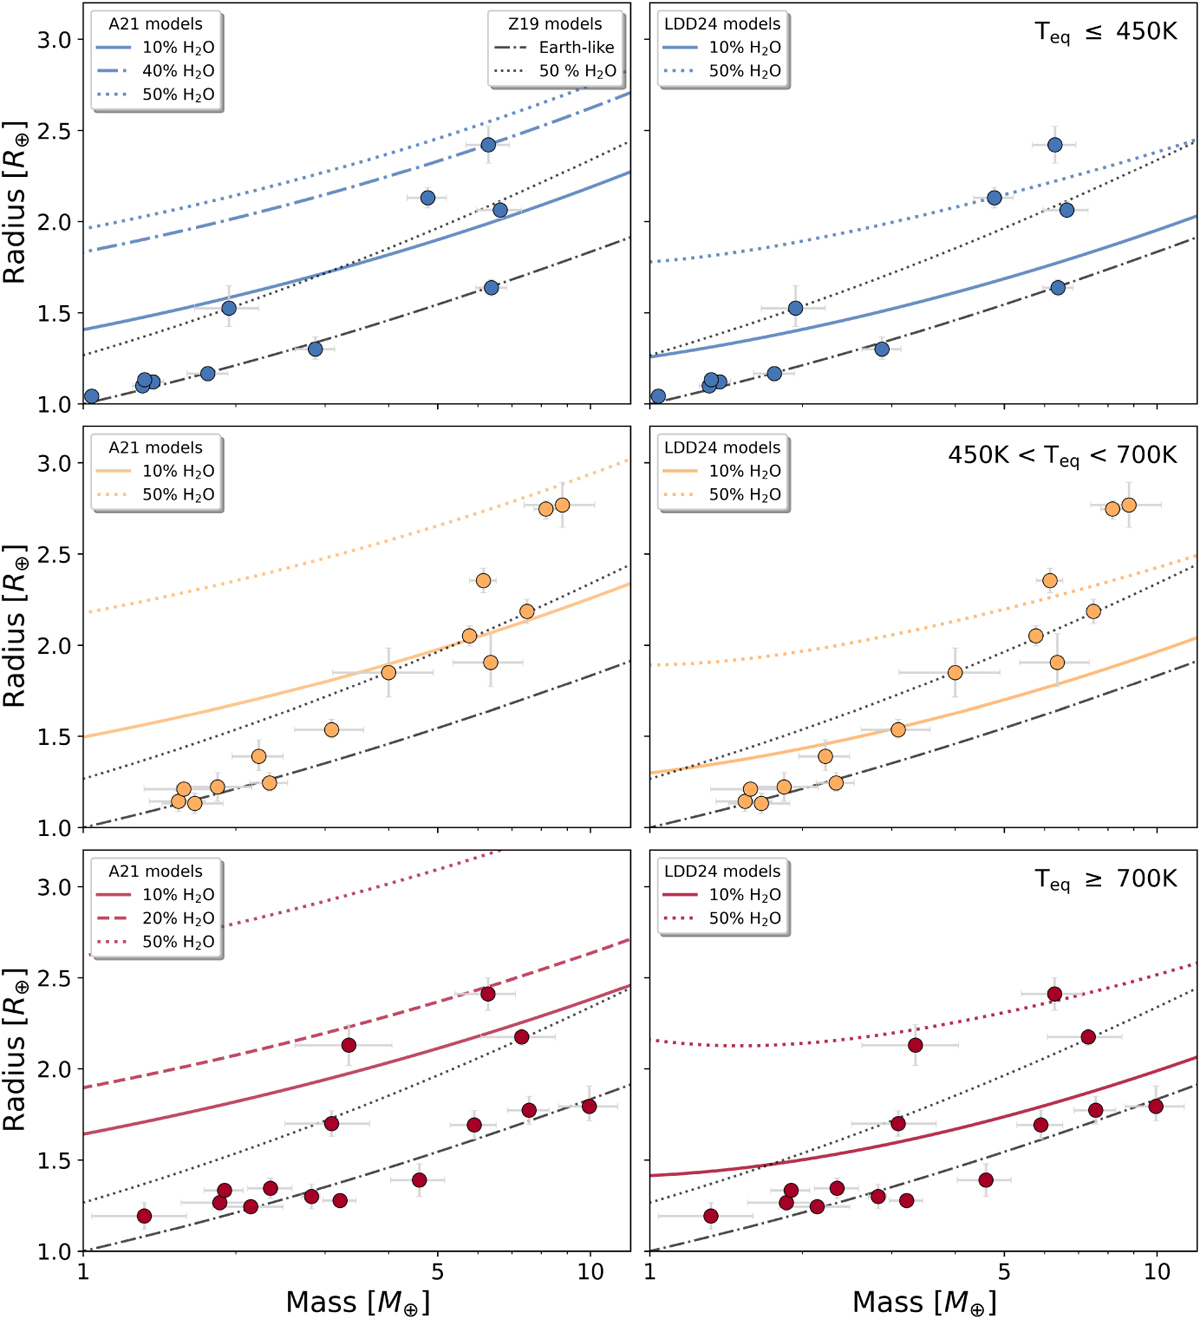
Mass–radius diagrams of small planets orbiting M-dwarfs, focusing on those larger and more massive than Earth, up to 3 R⊕. The three rows correspond to three equilibrium temperature intervals, with planets with Teq ≤ 450 K at the top, 450 K < Teq < 700 K in the middle, and at the bottom Teq ≥ 700 K. The two columns correspond to the two internal structure models, from Aguichine et al. (2021) (A21) on the left and from Luo et al. (2024) (LDD24) on the right. The composition lines are drawn from these models at the average temperatures of planets in the intervals, 400 K, 550 K, and 800 K for cold, warm, and hot respectively. Each panels feature Zeng et al. (2019)’s terrestrial and 50% water composition lines represented by black dash-dotted lines and dotted respectively.
Current usage metrics show cumulative count of Article Views (full-text article views including HTML views, PDF and ePub downloads, according to the available data) and Abstracts Views on Vision4Press platform.
Data correspond to usage on the plateform after 2015. The current usage metrics is available 48-96 hours after online publication and is updated daily on week days.
Initial download of the metrics may take a while.