Fig. C.1
Download original image
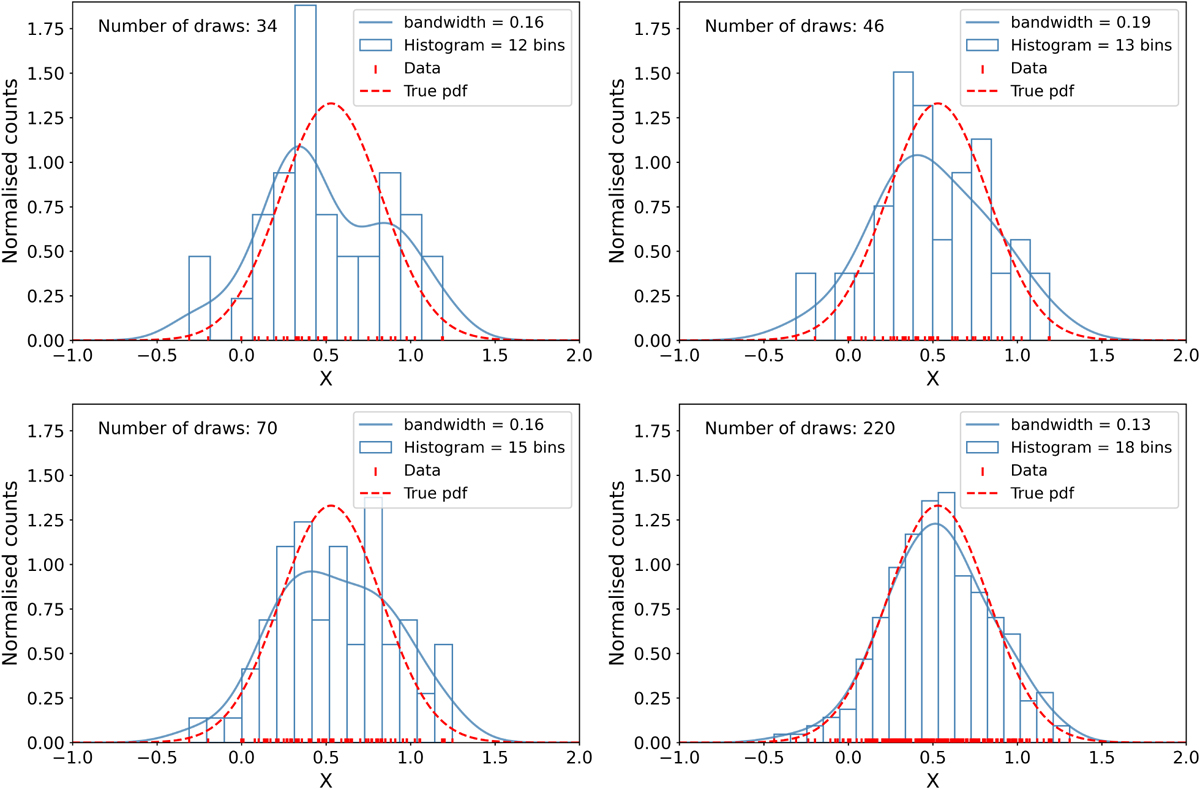
Comparison of histogram and KDE performance in representing a random draw in a Gaussian distribution. Each panel corresponds to a specific number of draws in the Gaussian distribution (n=34, 46, 70, 220). The actual distribution is depicted in red, with red dashed lines indicating randomly drawn points from this real distribution (using a fixed seed for repeatability). The histogram is presented with blue outlines, and the KDE is represented by a blue line. The legend provides information about the bins and bandwidth, determined by Sturges’ rule and cross-validation, respectively, for each case.
Current usage metrics show cumulative count of Article Views (full-text article views including HTML views, PDF and ePub downloads, according to the available data) and Abstracts Views on Vision4Press platform.
Data correspond to usage on the plateform after 2015. The current usage metrics is available 48-96 hours after online publication and is updated daily on week days.
Initial download of the metrics may take a while.