Fig. 1
Download original image
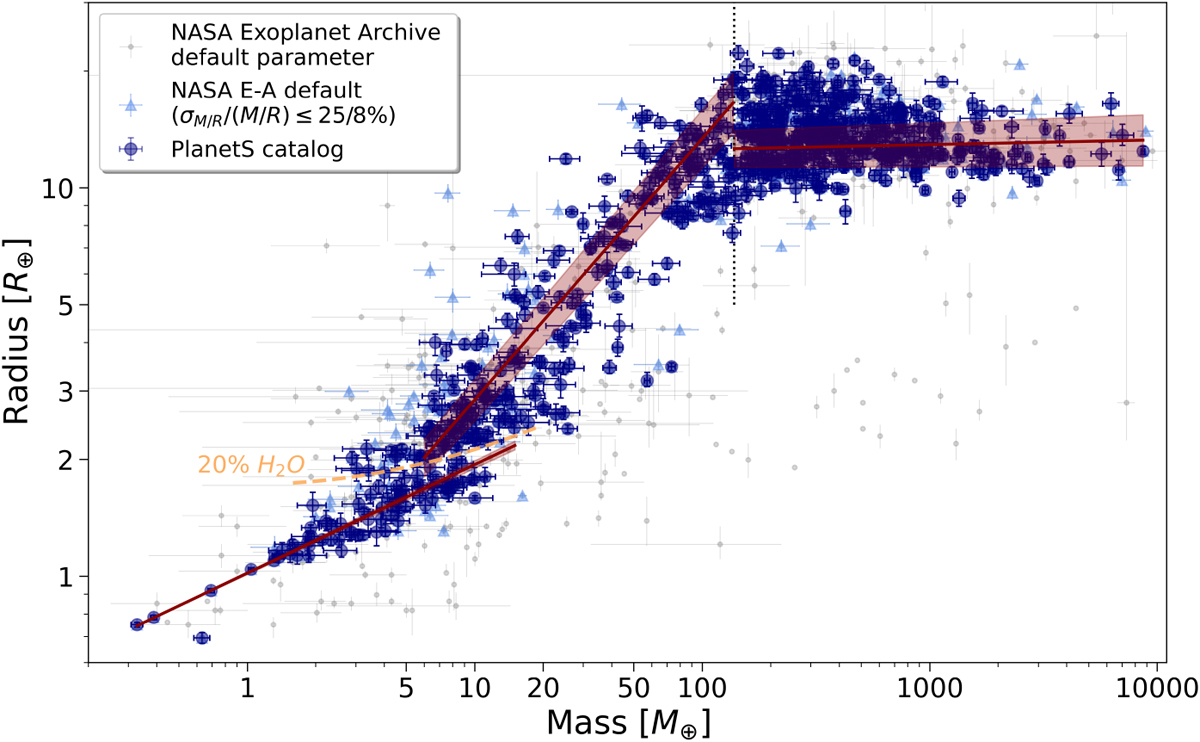
Mass–radius diagram comparing the data from the PlanetS catalog and the data from NASA Exoplanet Archive to highlight the effects of our selection criteria and our detailed study of references. The gray dots represented the default parameters from NASA, the light blue triangles the same but filtered with our criteria on uncertainties and the blue dots correspond to the PlanetS catalog. The resulting M–R relationships from Sect. 2.2 are shown as solid red lines with the confidence intervals represented by the shaded red areas. The transitions between the three populations are represented by the composition line of 20% water at 650 K from Luo et al. (2024) in dashed orange and the dotted black line at 138 M⊕.
Current usage metrics show cumulative count of Article Views (full-text article views including HTML views, PDF and ePub downloads, according to the available data) and Abstracts Views on Vision4Press platform.
Data correspond to usage on the plateform after 2015. The current usage metrics is available 48-96 hours after online publication and is updated daily on week days.
Initial download of the metrics may take a while.