Open Access
Fig. 6.
Download original image
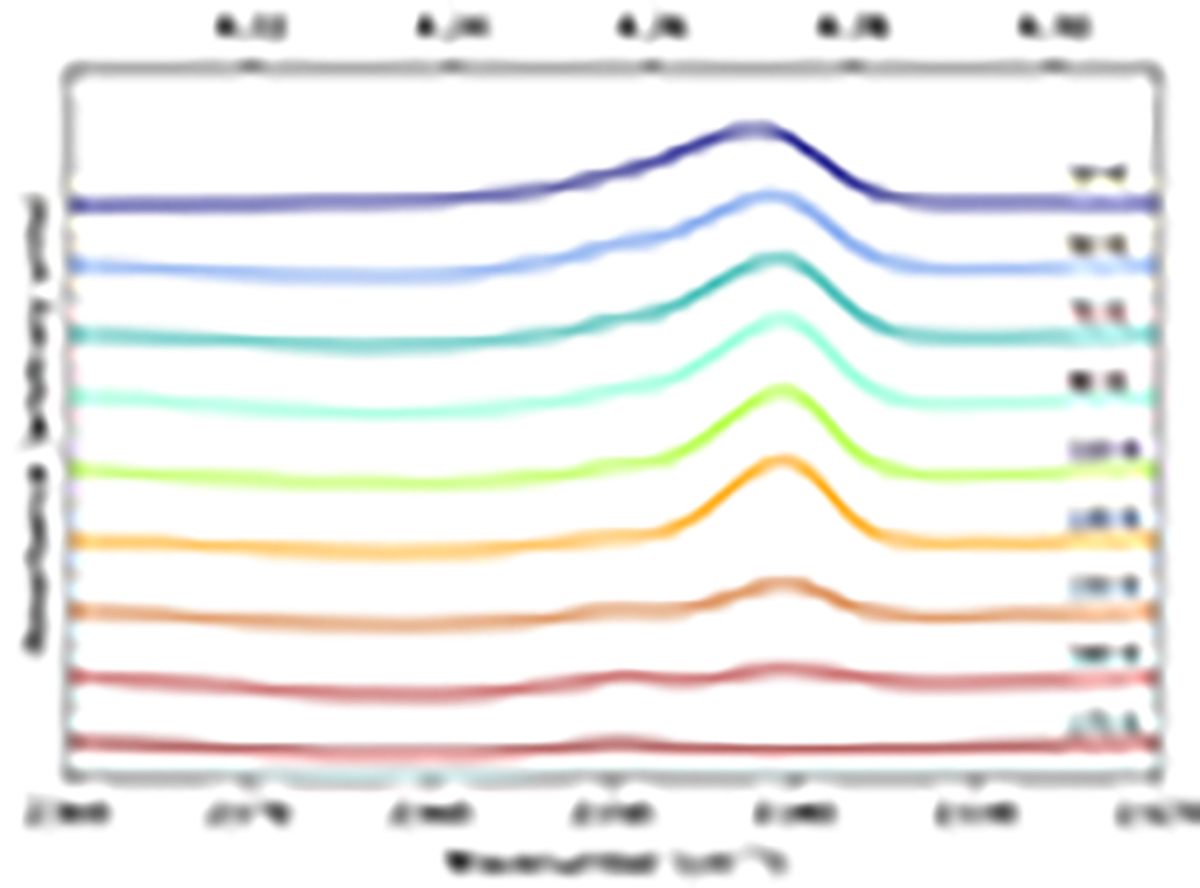
Spectra over the 2380−2320 cm−1 (4.20−4.31 μm) range of the H2O:CO2 = 1:0.04 ice mixture deposited at 10 K and 2 × 10⁻⁷ mbar. All spectra are measured with 2 cm−1 resolution at the temperatures indicated in each graph. Spectra are shifted vertically for clarity.
Current usage metrics show cumulative count of Article Views (full-text article views including HTML views, PDF and ePub downloads, according to the available data) and Abstracts Views on Vision4Press platform.
Data correspond to usage on the plateform after 2015. The current usage metrics is available 48-96 hours after online publication and is updated daily on week days.
Initial download of the metrics may take a while.