Open Access
Fig. 5.
Download original image
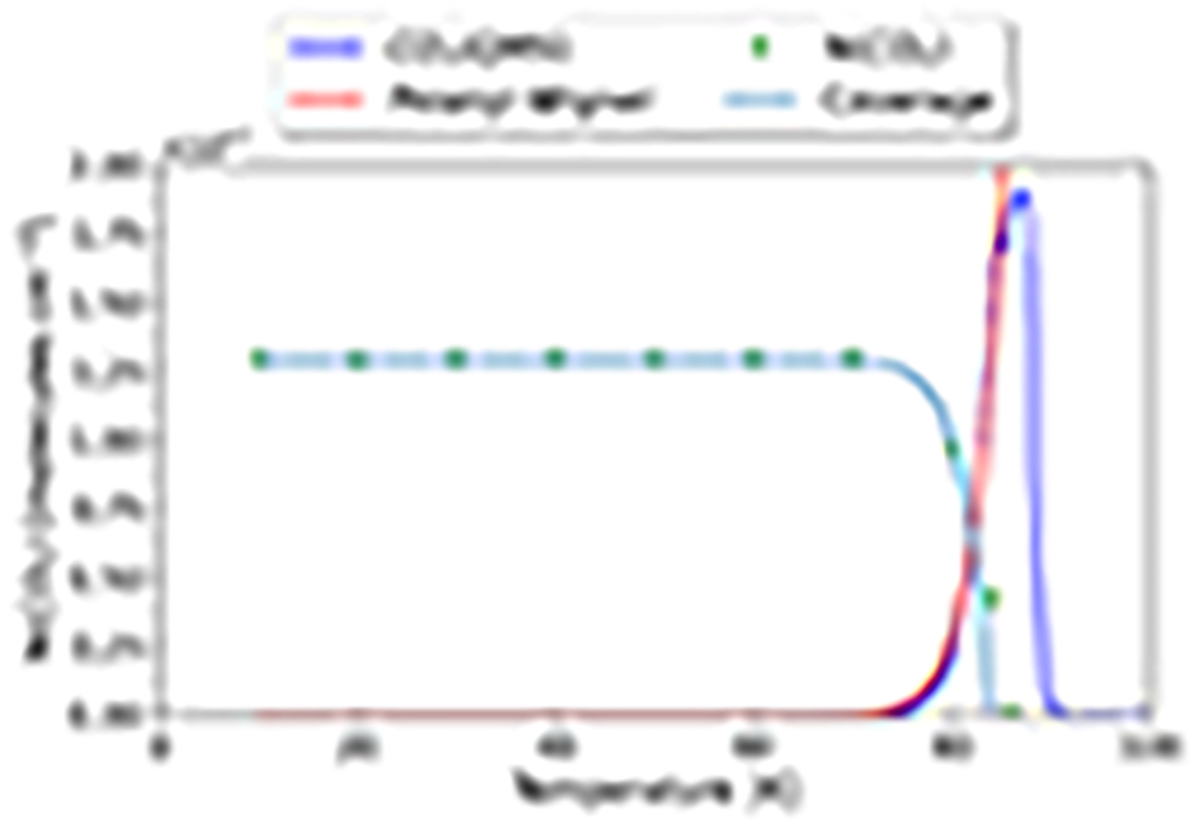
Column density of CO2 ice (triangles) calculated from IR measurements matches the calculated coverage (light blue line). TPD curve of CO2 from QMS measurements (dark blue) agrees well with the fit corresponding to the Polanyi-Wigner equation (red line).
Current usage metrics show cumulative count of Article Views (full-text article views including HTML views, PDF and ePub downloads, according to the available data) and Abstracts Views on Vision4Press platform.
Data correspond to usage on the plateform after 2015. The current usage metrics is available 48-96 hours after online publication and is updated daily on week days.
Initial download of the metrics may take a while.