Open Access
Fig. 4.
Download original image
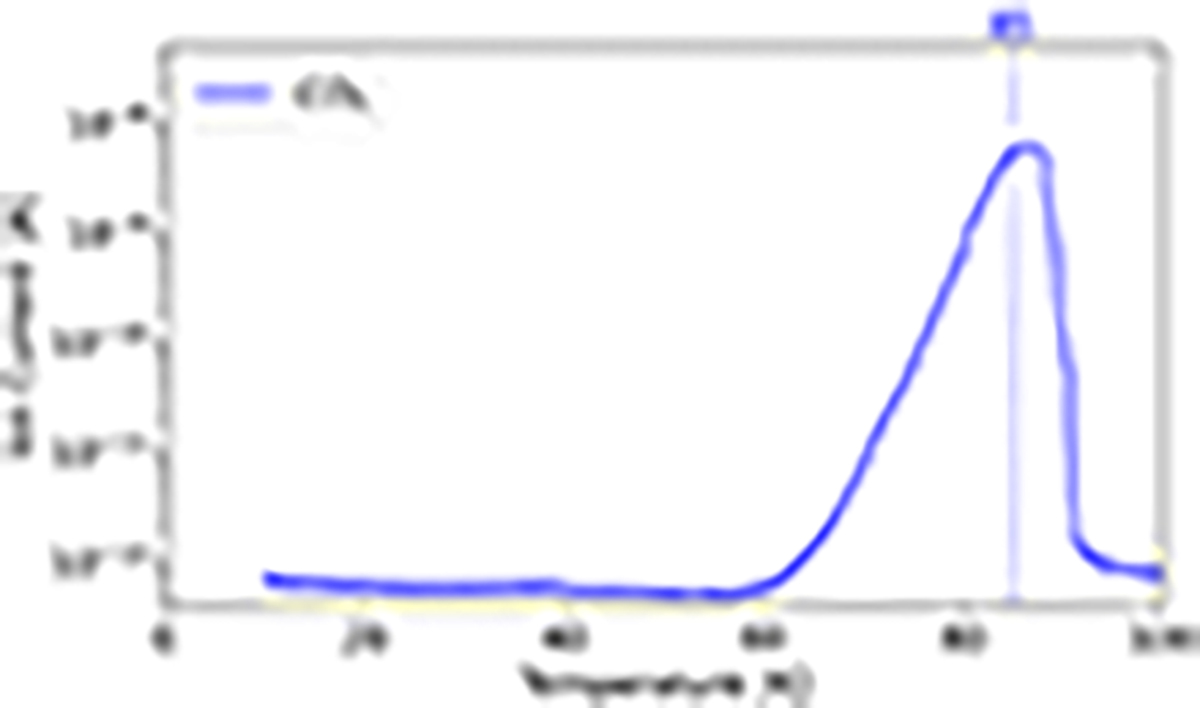
TPD curve of pure CO2 ice layer deposited at 10 K and heated at 0.5 K/min. The ion current (A) is plotted on a logarithmic scale for a better appreciation of the curve profile and roughly corresponds to partial pressure in mbar.
Current usage metrics show cumulative count of Article Views (full-text article views including HTML views, PDF and ePub downloads, according to the available data) and Abstracts Views on Vision4Press platform.
Data correspond to usage on the plateform after 2015. The current usage metrics is available 48-96 hours after online publication and is updated daily on week days.
Initial download of the metrics may take a while.