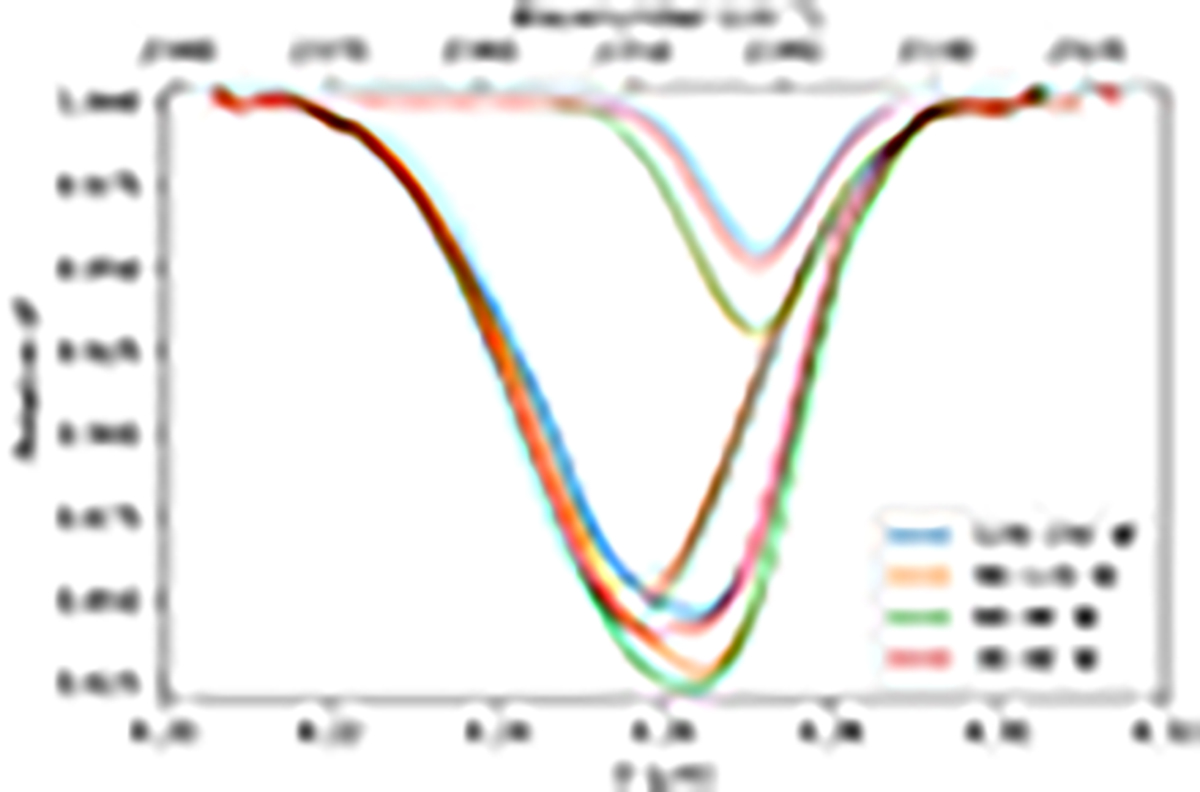
Fig. 13.
Download original image
Longitudinal spectra of Ganymede’s leading hemisphere acquired with JWST. The longitudes are taken between 60° North and 60° South in latitude. The spectrum for 120−150 W represents the morning limb of the leading edge and the evening limb by the 30−60 W spectrum. Colors are used to indicate different longitudinal ranges. The dotted lines represent the Gaussian fit of each individual spectrum which is deconvolved into two Gaussians.
Current usage metrics show cumulative count of Article Views (full-text article views including HTML views, PDF and ePub downloads, according to the available data) and Abstracts Views on Vision4Press platform.
Data correspond to usage on the plateform after 2015. The current usage metrics is available 48-96 hours after online publication and is updated daily on week days.
Initial download of the metrics may take a while.