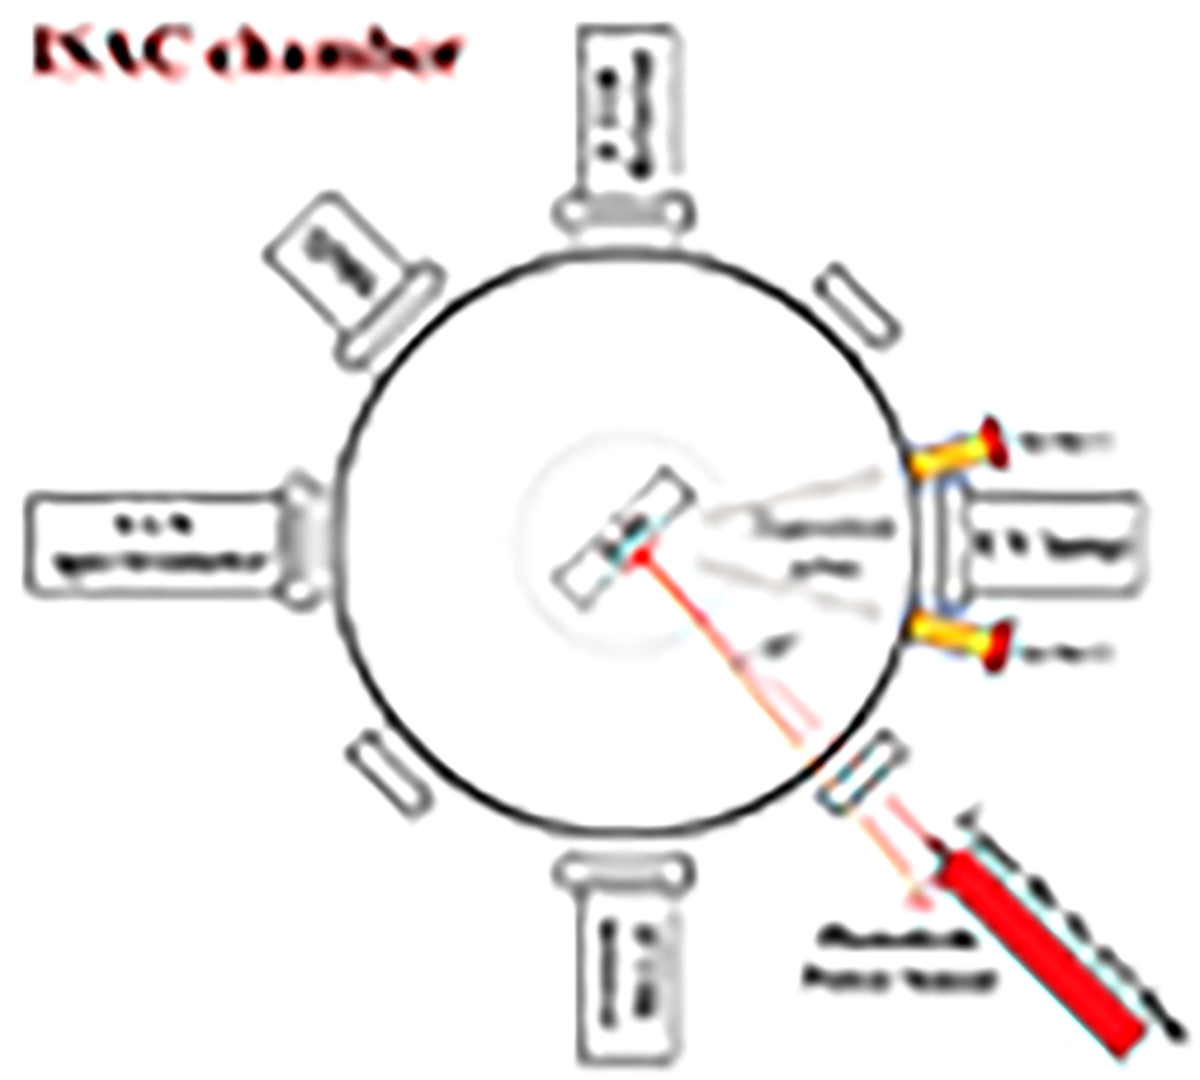
Fig. 1.
Download original image
ISAC cross-section at the ice sample level. The measuring devices and sensors, including the laser interferometry, are displayed. The FTIR source is positioned on one side and the FTIR detector on the opposite one. The UV spectrometer is placed directly across from the vacuum-UV lamp, see González Díaz et al. (2022) for more details.
Current usage metrics show cumulative count of Article Views (full-text article views including HTML views, PDF and ePub downloads, according to the available data) and Abstracts Views on Vision4Press platform.
Data correspond to usage on the plateform after 2015. The current usage metrics is available 48-96 hours after online publication and is updated daily on week days.
Initial download of the metrics may take a while.