Fig. 9.
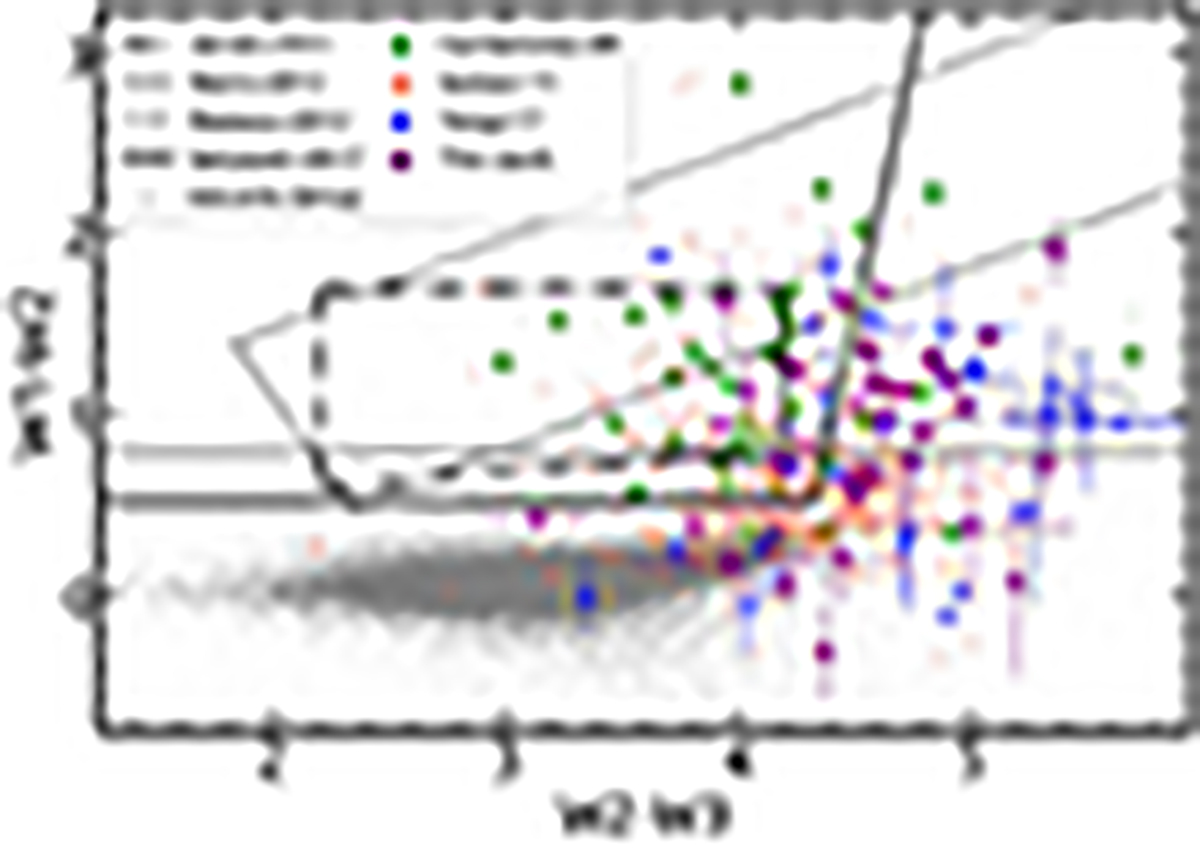
Download original image
Color-color W1 − W2 versus W2 − W3 diagram for the samples of Cardamone et al. (2009) (green rhombuses), Izotov et al. (2011) (red X’s), Yang et al. (2017) (blue squares), this work’s BBs (purple circles), and the SFGs of the HECATE catalog (gray dots). Uncertainties for the HECATE and Izotov et al. (2011) galaxies are not shown for greater clarity; however, all plotted sources have S/N > 2 in the used WISE bands 1, 2, and 3. The black dashed-dotted, gray continuous, black dotted, and black continuous lines respectively show the Jarrett et al. (2011), Stern et al. (2012), Mateos et al. (2012), and Satyapal et al. (2018) criteria defined to identify AGNs and quasar sources.
Current usage metrics show cumulative count of Article Views (full-text article views including HTML views, PDF and ePub downloads, according to the available data) and Abstracts Views on Vision4Press platform.
Data correspond to usage on the plateform after 2015. The current usage metrics is available 48-96 hours after online publication and is updated daily on week days.
Initial download of the metrics may take a while.