Fig. 6.
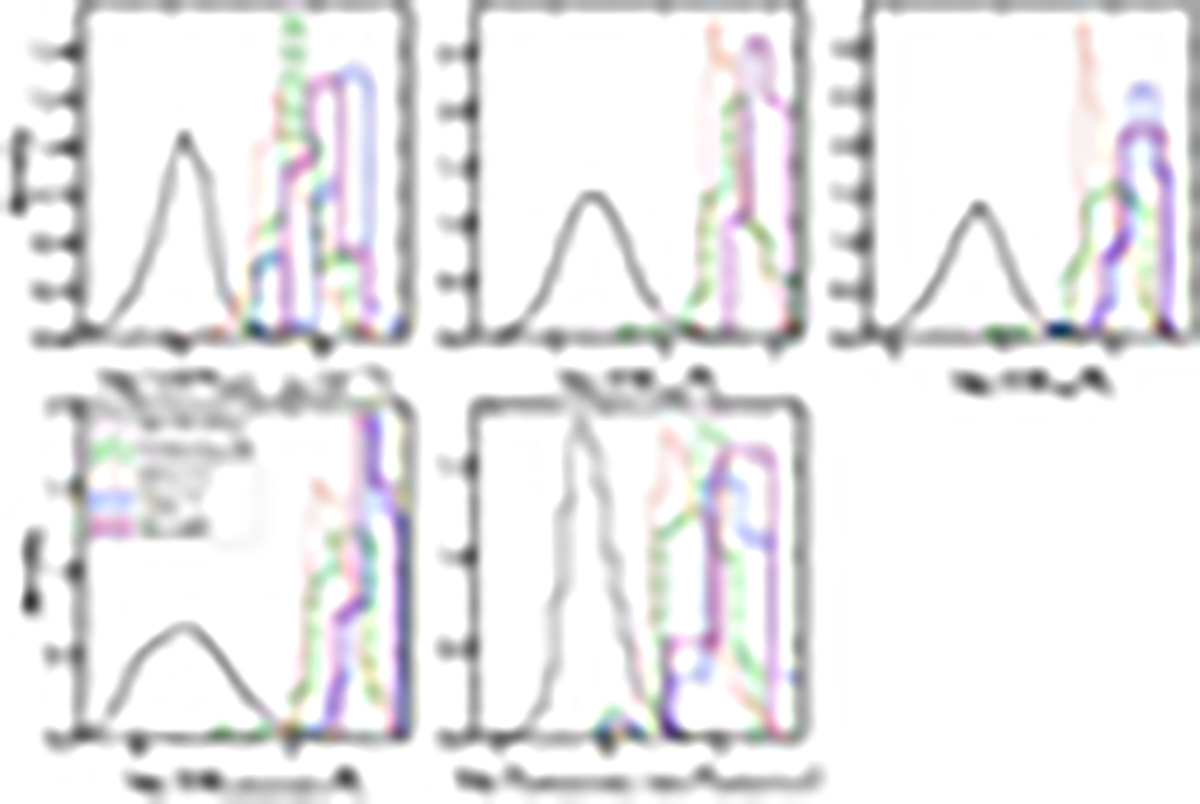
Download original image
Histograms of (from left to right and top to bottom) the logarithm of the sSFRs; the EWs of Hα, Hβ, and [O III]λ5007; and the flux ratios of [O III]λλ4363,5007/[O II]λ3727 of the samples of Cardamone et al. (2009) (green dashed-dotted line), Izotov et al. (2011) (red dotted line), Yang et al. (2017) (blue dashed line), the SFGs of HECATE (gray line), and the spectroscopic subsample of this work’s BBs (purple continuum line).
Current usage metrics show cumulative count of Article Views (full-text article views including HTML views, PDF and ePub downloads, according to the available data) and Abstracts Views on Vision4Press platform.
Data correspond to usage on the plateform after 2015. The current usage metrics is available 48-96 hours after online publication and is updated daily on week days.
Initial download of the metrics may take a while.