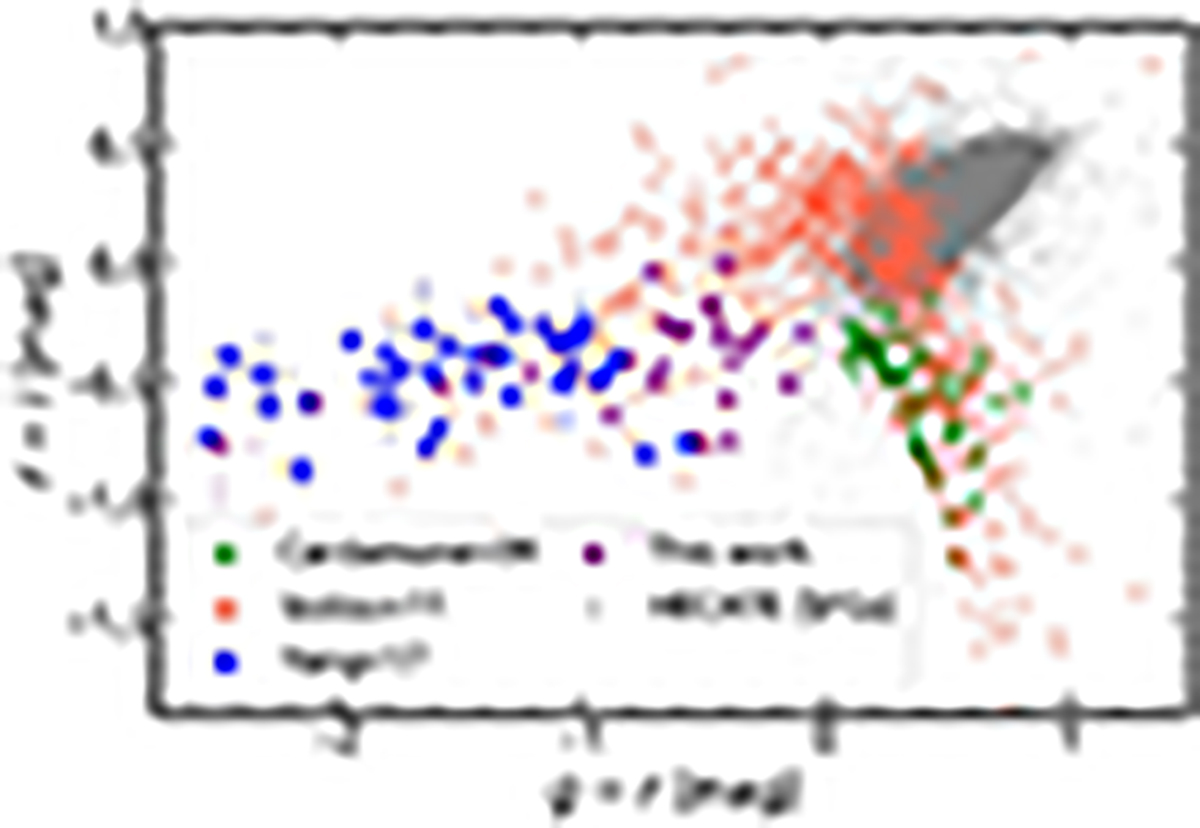
Fig. 5.
Download original image
Color-color r − i versus g − r diagram with applied k-corrections. Gray dots, green rhombuses, red X’s, blue squares, and purple circles respectively show sources of the HECATE SFGs, the Cardamone et al. (2009), the Izotov et al. (2011), the Yang et al. (2017), and this work’s samples. Uncertainties are shown only for the BBs for clarity.
Current usage metrics show cumulative count of Article Views (full-text article views including HTML views, PDF and ePub downloads, according to the available data) and Abstracts Views on Vision4Press platform.
Data correspond to usage on the plateform after 2015. The current usage metrics is available 48-96 hours after online publication and is updated daily on week days.
Initial download of the metrics may take a while.