Fig. 4.

Download original image
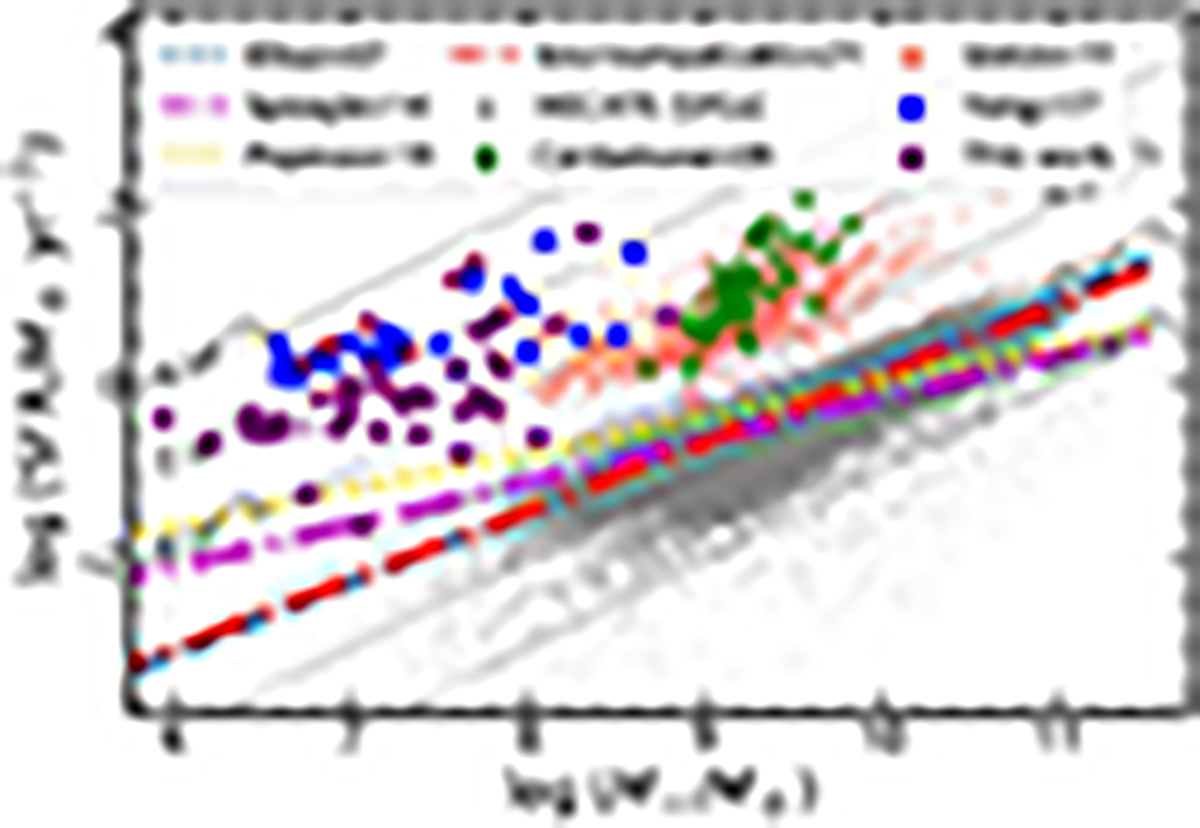
Star-formation rate as a function of the stellar mass of the BBs of this work (purple circles), the BBs of Yang et al. (2017) (blue squares), the GPs of Cardamone et al. (2009) (green rhombuses), the BDGs of Izotov et al. (2011) (red X’s), and the SFGs of HECATE (gray dots). The blue dashed, magenta dashed-dotted, yellow dotted, and red dashed-dotted lines respectively show the main sequence fits of Elbaz et al. (2007), Speagle et al. (2014), Popesso et al. (2019), and Kouroumpatzakis et al. (2021). The thin black dashed lines indicate some constant values of log sSFR.
Current usage metrics show cumulative count of Article Views (full-text article views including HTML views, PDF and ePub downloads, according to the available data) and Abstracts Views on Vision4Press platform.
Data correspond to usage on the plateform after 2015. The current usage metrics is available 48-96 hours after online publication and is updated daily on week days.
Initial download of the metrics may take a while.


