Fig. B.2.
Download original image
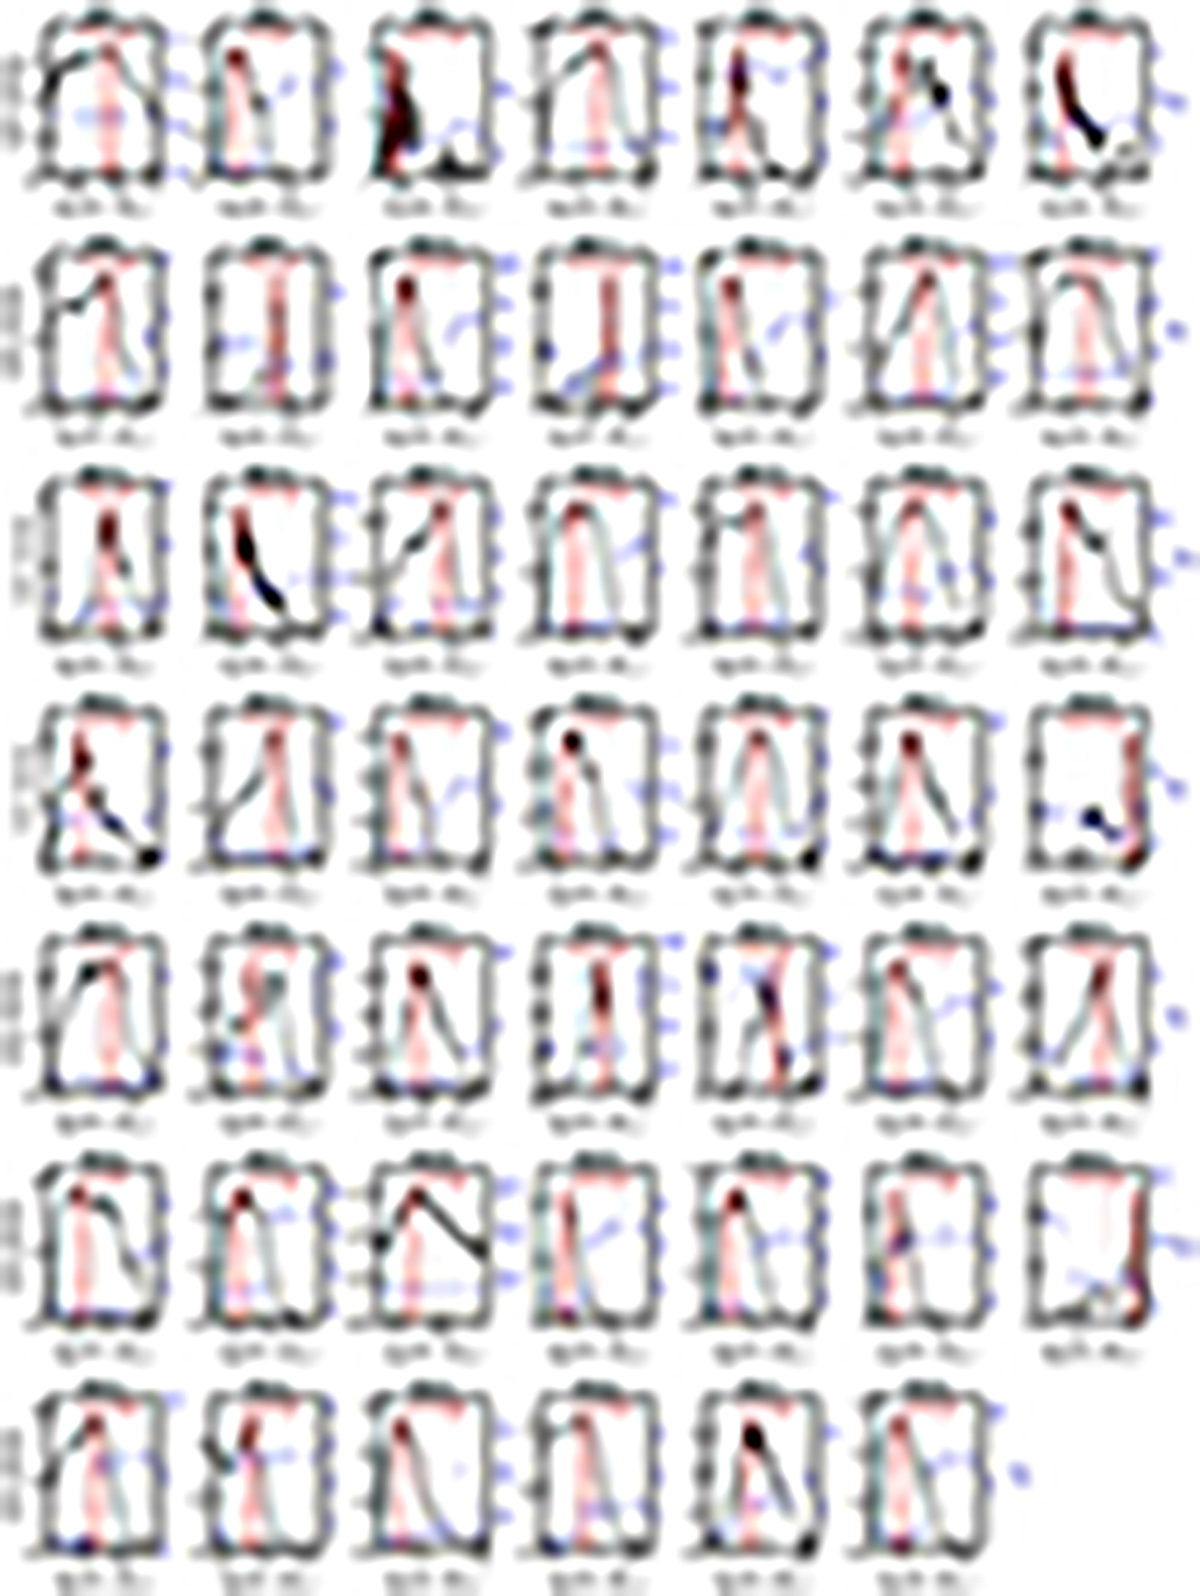
Stellar mass ![]() -weighted probability densities of all CIGALE models (black line). Each panel represents the modeling of an individual BB. The distribution modes and CIs are shown with vertical dashed and dotted red lines, respectively. The logarithm of the estimated M⋆ is shown at the top of each panel with red fonts. The blue error bars represent the bin modes and CIs of the model’s
-weighted probability densities of all CIGALE models (black line). Each panel represents the modeling of an individual BB. The distribution modes and CIs are shown with vertical dashed and dotted red lines, respectively. The logarithm of the estimated M⋆ is shown at the top of each panel with red fonts. The blue error bars represent the bin modes and CIs of the model’s ![]() at the plotted M⋆ range divided into 12 bins, while the right y-axis corresponds to the
at the plotted M⋆ range divided into 12 bins, while the right y-axis corresponds to the ![]() values.
values.
Current usage metrics show cumulative count of Article Views (full-text article views including HTML views, PDF and ePub downloads, according to the available data) and Abstracts Views on Vision4Press platform.
Data correspond to usage on the plateform after 2015. The current usage metrics is available 48-96 hours after online publication and is updated daily on week days.
Initial download of the metrics may take a while.