Fig. B.1.
Download original image
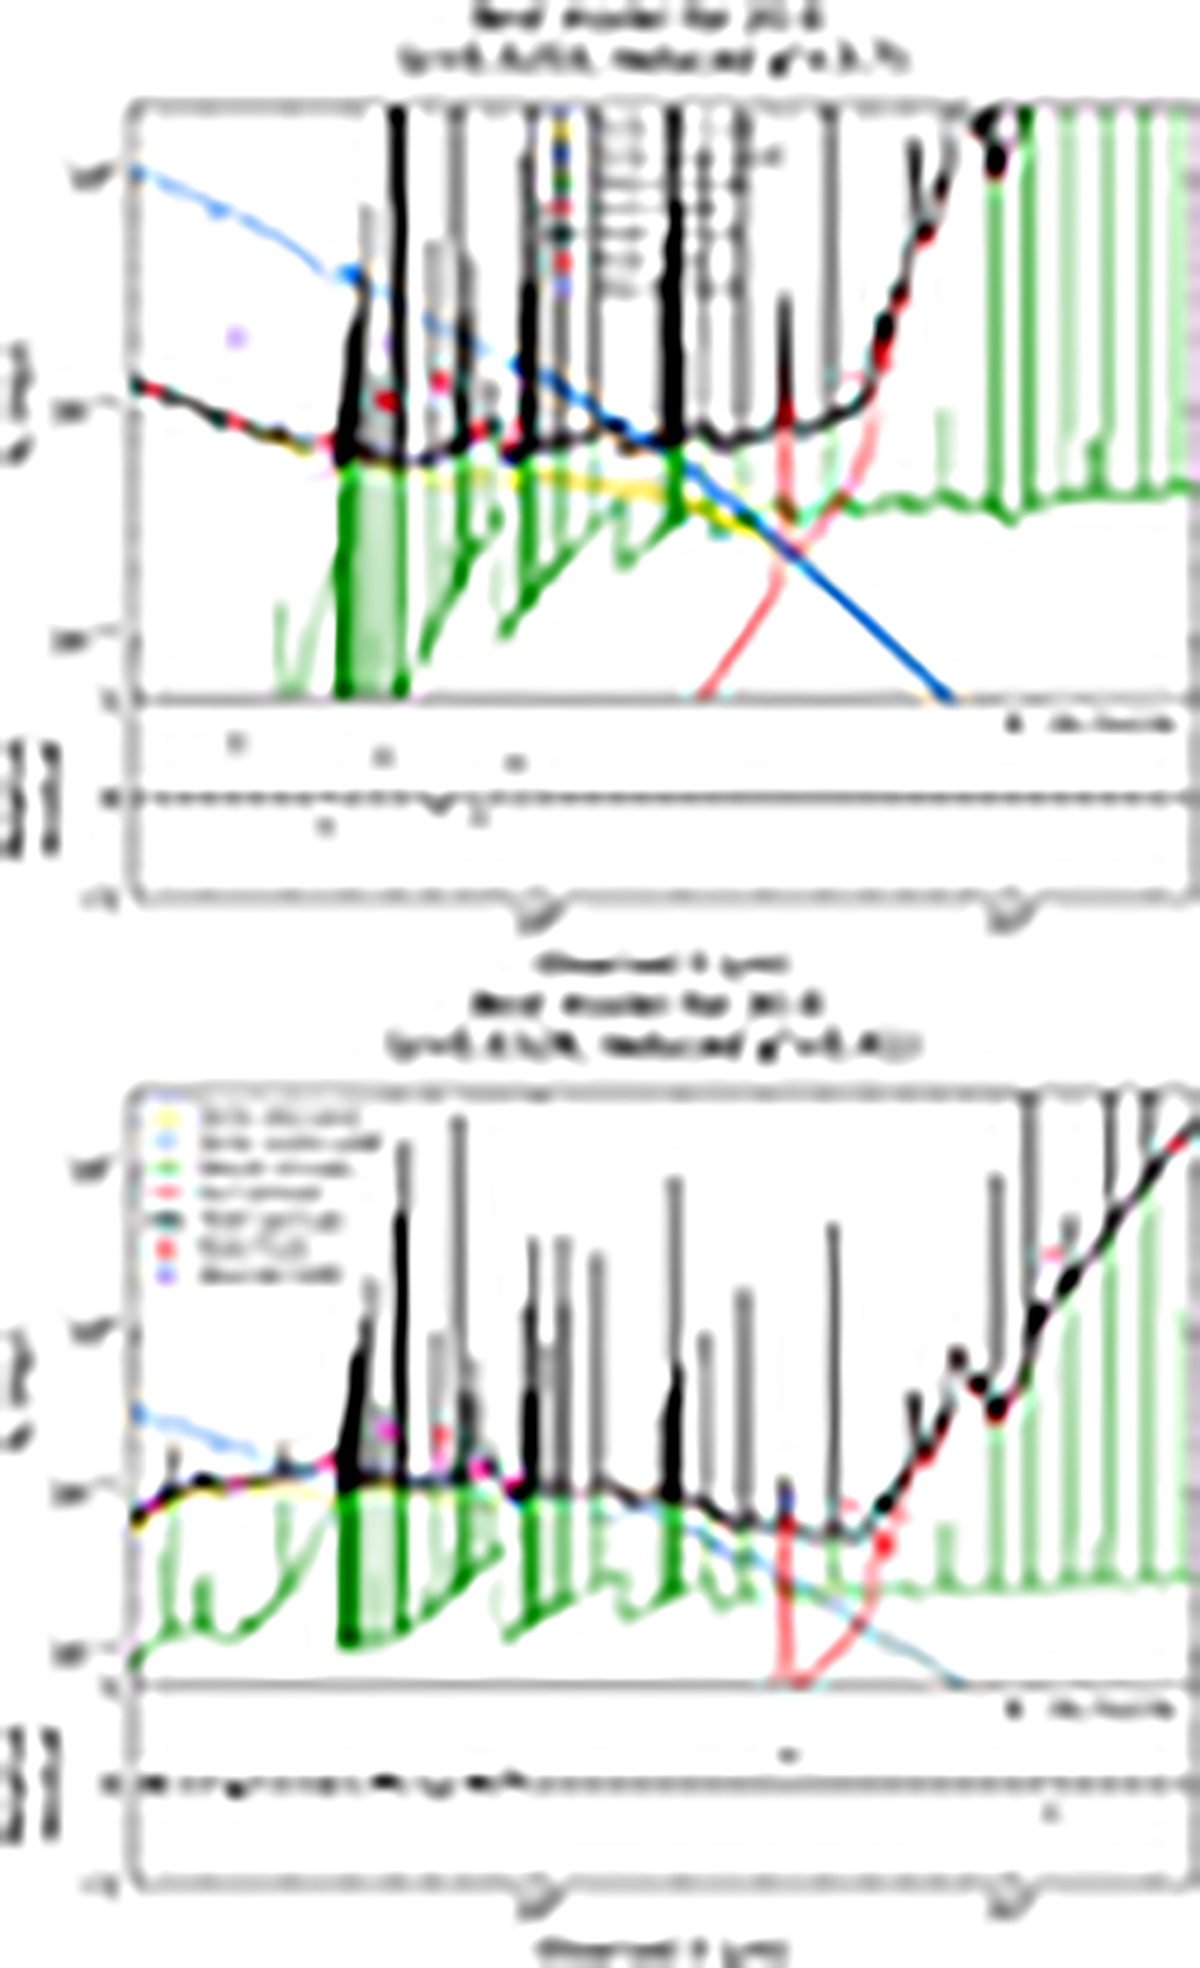
Spectral energy distributions and CIGALE fits for BB 20 (top panel) and BB 30 (bottom panel). The stellar attenuated and unattenuated continuum is shown with yellow and blue dashed lines, respectively. The green, red, and black lines show the nebular, dust, and total emission, respectively. The observed fluxes are shown with purple open circles, and the estimated fluxes are shown with red circles.
Current usage metrics show cumulative count of Article Views (full-text article views including HTML views, PDF and ePub downloads, according to the available data) and Abstracts Views on Vision4Press platform.
Data correspond to usage on the plateform after 2015. The current usage metrics is available 48-96 hours after online publication and is updated daily on week days.
Initial download of the metrics may take a while.